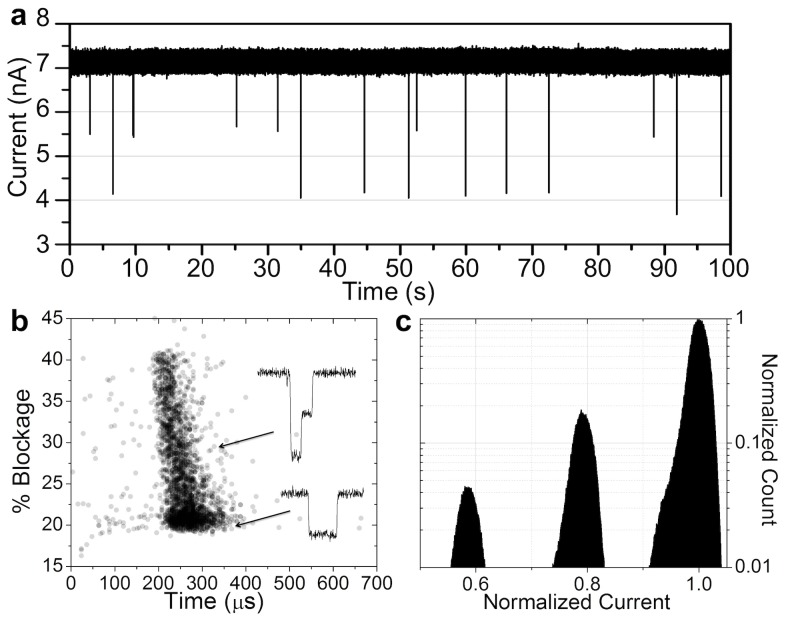
Figure 4. DNA Translocations.
a) Ionic current trace showing multiple DNA translocation events through a ∼6.4-nm pore in a 10-nm-thick SiNx membrane. Experiments performed with 10μg/mL of 5-kb DNA fragments in 3.6 M LiCl pH8, at 200 mV using an Axopatch 200B. Data sampled at 250 kHz and low-pass filtered at 100 kHz. b) Scatter plot of the normalized average current blockade (0% presenting a fully opened pore, and 100% a fully blocked pore) versus the total translocation time of a single-molecule event. Each data point represents a single DNA translocation event. The majority of the events are unfolded. There are very few anomalously long events, indicating weak DNA-pore interactions. The inset shows ionic current signatures of two single-molecule translocation events, passing in a linear and partially folded conformation. c) Histogram of the current level revealing the expected quantization of the amplitude of current blockades. Quantized levels corresponding to zero, one, two dsDNA strands in the nanopore are clearly observed.

