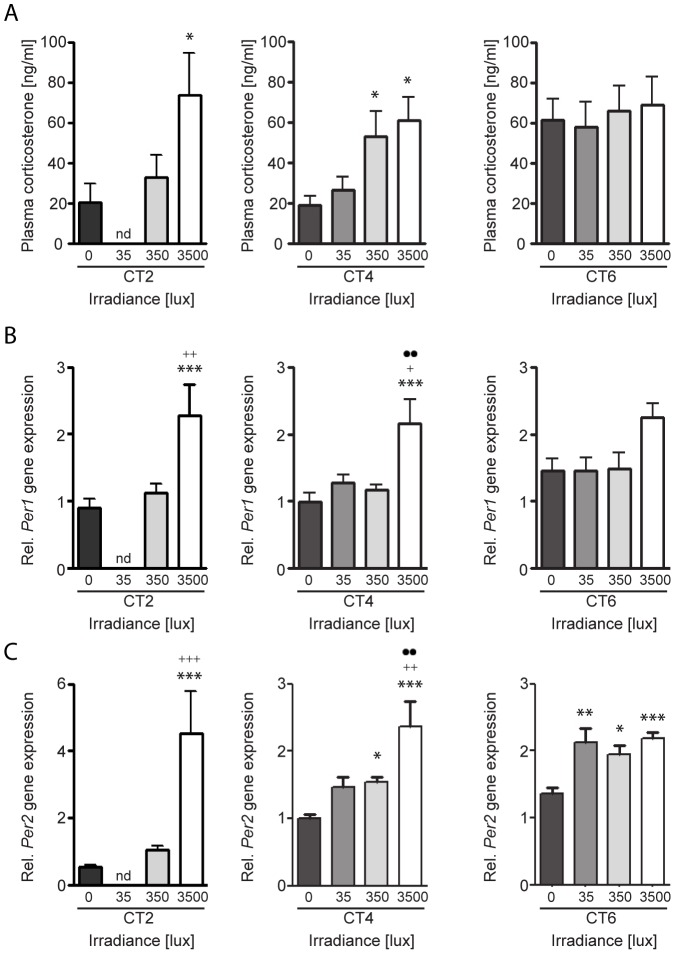
Figure 2. Irradiance dependent effect of light on plasma corticosterone and adrenal Per1 and Per2 expression.
The effects of a 30(A, top row), adrenal Per1 mRNA expression (B, middle row), and adrenal Per2 mRNA expression (C, bottom row). Samples were collected 60 min after the beginning of the light pulse during the subjective day at circadian time (CT) 2, CT4, and CT6. The differences between dark controls (0 lux) and light-pulsed animals are indicated by asterisks (*p<0.05, **p<0.01, ***p<0.001), to 35 lux light-pulsed animals by plus signs (+p<0.05, ++p<0.01) and to 350 lux light-pulsed animals by dots (··p<0.01); One-Way ANOVA, n = 4–9 animals/group.

