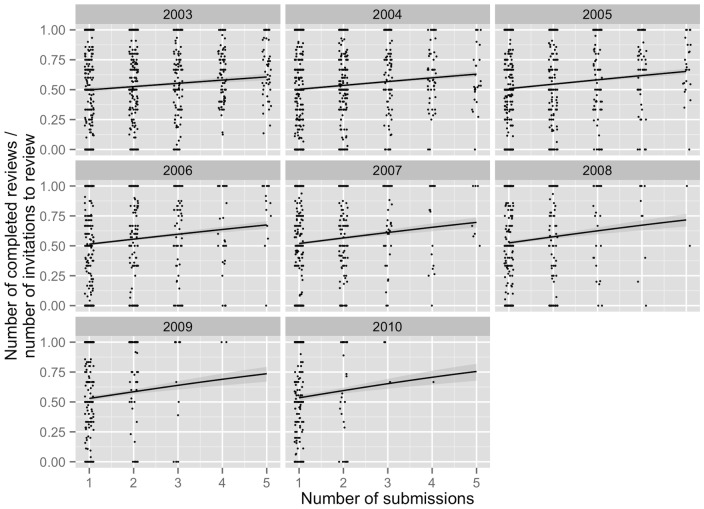
Figure 2. Individual researchers review completion rate, with separate graphs corresponding to the year the researchers entered the database.
Lines are predictions from a quasibinomial response variable model with number of submissions, year of first submission, and their interaction, as continuous explanatory variables. The data analysed was limited to individual researchers with less than six submission, in order to avoid comparing across very different ranges of number of submissions. The model was part of an exploratory analysis, so use of p-values is inappropriate. X-axis values are jittered slightly

