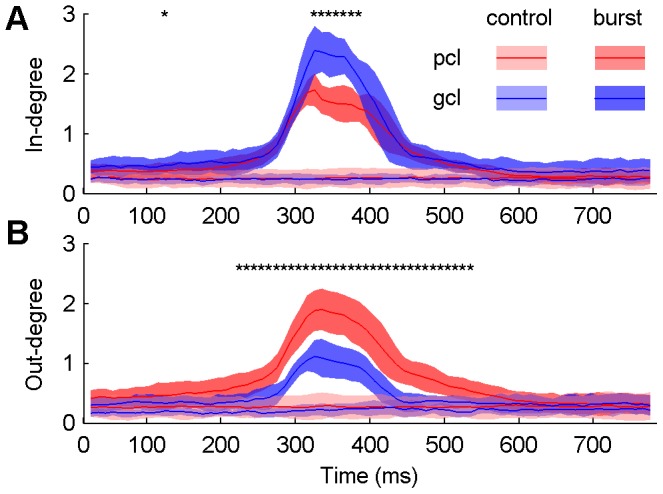
Figure 3. The in- and out-degree of nodes in hippocampal networks.

Averaged in-degree (A) and out-degree (B) of the nodes in the pyramidal cell layer (pcl) and the granule cell layer (gcl) of the hippocampal slice in control (light shades and lines) and epileptiform discharges (dark shades and lines). Lines denote mean values and shades denote standard errors. Differences of the averaged in-degree/out-degree of nodes in the pcl and the gcl during epileptiform discharges are tested (*P<0.05, n = 8, paired t-test with FDR correction).
