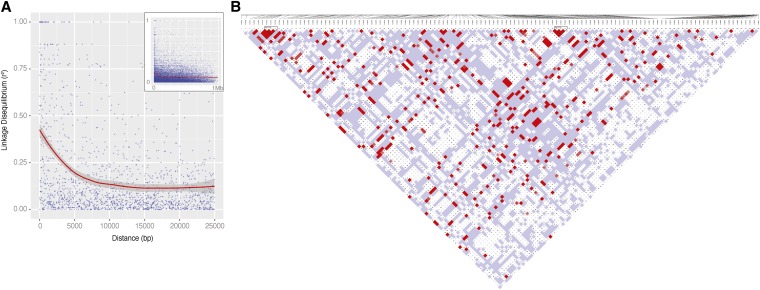
Figure 4.
Linkage disequilibrium (LD) in the Kiyosu medaka population. (A) Decay of LD for a sample of medaka SNPs. LD (r2) was calculated for all SNP pairs in 1-Mb windows overlapping by 500 kb across medaka chromosome 1, and r2 was plotted against distance for a sample of 0.03% (21976) of pairs. The main plot shows a blow-up of distances between 0 and 25 kb, with data for pairs of SNPs up to 1 Mb apart shown in the inset region. Multiple sampling and analysis of other chromosomes gave similar results (not shown). (B) Pairwise LD plot for a representative region of chromosome 11. Pairwise LD (D′) for the 25-kb region 11:375000−399999 as displayed in Haploview is shown. The plot shows the LD of pairs of SNPs by squares joining the two SNPs via the diagonal and is color coded as described for the standard LD color scheme at http://www.broadinstitute.org/science/programs/medical-and-population-genetics/haploview/ld-display such that pairs of SNPs in LD at D′ = 1 are colored blue at LOD <2 and red at LOD ≥ 2, whereas those with D′ < 1 are white at LOD < 2 and shades of red/pink at LOD ≥ 2.

