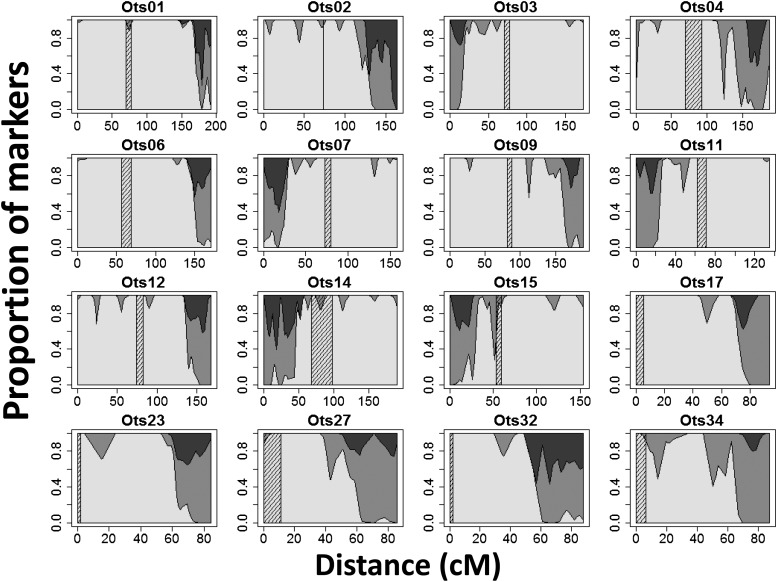
Figure 5.
Proportion of duplicated and non-duplicated loci along the 16 linkage groups (denoted by chromosome number) with a high number of duplicated loci. Non-duplicated loci are represented in white; Duplicated loci are represented in gray (loci with one paralog polymorphic) or in dark gray (loci with both paralogs polymorphic). The centromere is represented by the cross-hatched area. All chromosomes are oriented with the short arm (p) on the left where relevant.

