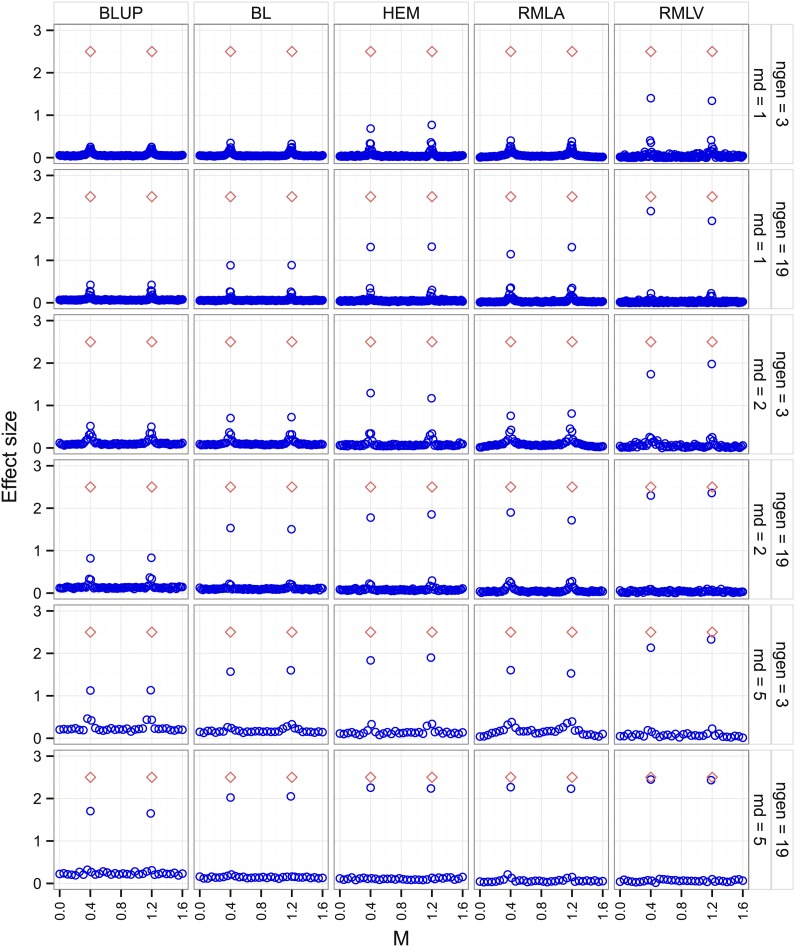
Figure 2.
Marker effects (blue circles) estimated with different GWP approaches in the simulated data set plotted against marker locations [M] for the first chromosome. The positions of the simulated quantitative trait loci are symbolized by open red diamonds, ngen is the number of random intermating generations, and md is the marker distance [cM] of two adjacent markers.

