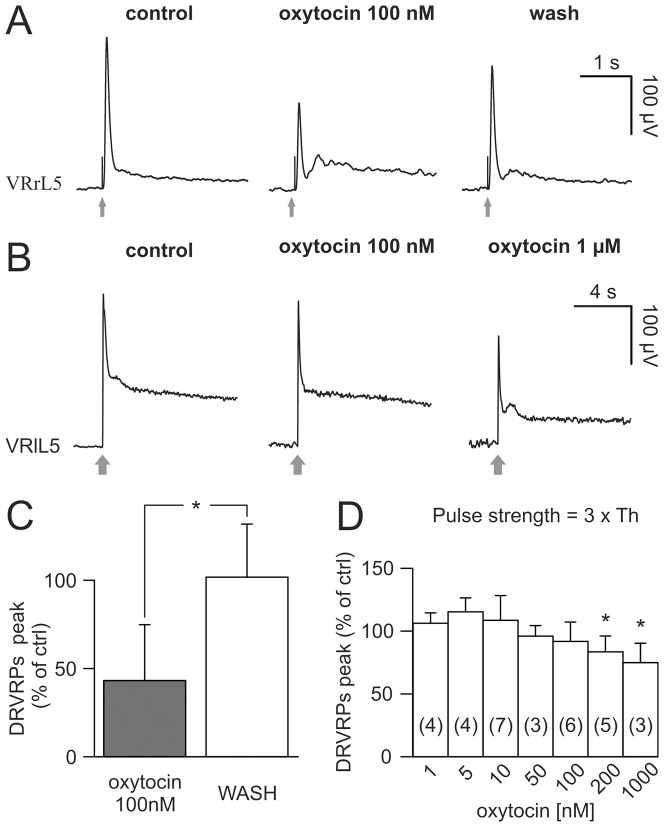
Figure 3. Oxytocin differentially affects DR-VRPs.
A, the monosynaptic response elicited by stimulating the homologous DR at just threshold intensity (duration = 0.1 ms; intensity = 15 μA, 1×Th) is significantly depressed by the addition of 100 nM of oxytocin, an effect that partially reversed after 20 min washout. B, DR-VRPs, extracellularly recorded from VRlL5, are evoked by strong electrical stimulation of the homologous DR (duration = 0.1 ms; intensity = 45 μA, 3×Th; arrows) in control (left), or after applying oxytocin 100 nM (middle) and 1 μM (right). Note records in B are shown on a slower time base to display the secondary component of polysynaptic DR-VRP and, therefore, hide the stimulus artifact. Only the highest tested concentration of the neuropeptide is able to reduce the peak of reflex response. Traces in A and B are mean values from five events and are obtained from different spinal cords. Histograms (C) show summary of responses to low strength of stimulation (1×Th) with significant reduction in the percentage peak obtained from 5 experiments (*; Mann-Whitney rank sum test; P = 0.016). D shows the average percentage variation in peak amplitude of DR-VRPs (with respect to control) evoked by strong stimuli (3×Th), against cumulative increase in oxytocin concentrations. Only the higher concentrations (0.2–1 μM) significantly depress responses (*; Kruskal-Wallis one way ANOVA on ranks followed by multiple comparison vs WASH with Dunn's method; P = 0.004, the number of preparations used to calculate the mean is shown in parentheses; the error bars indicate SD).

