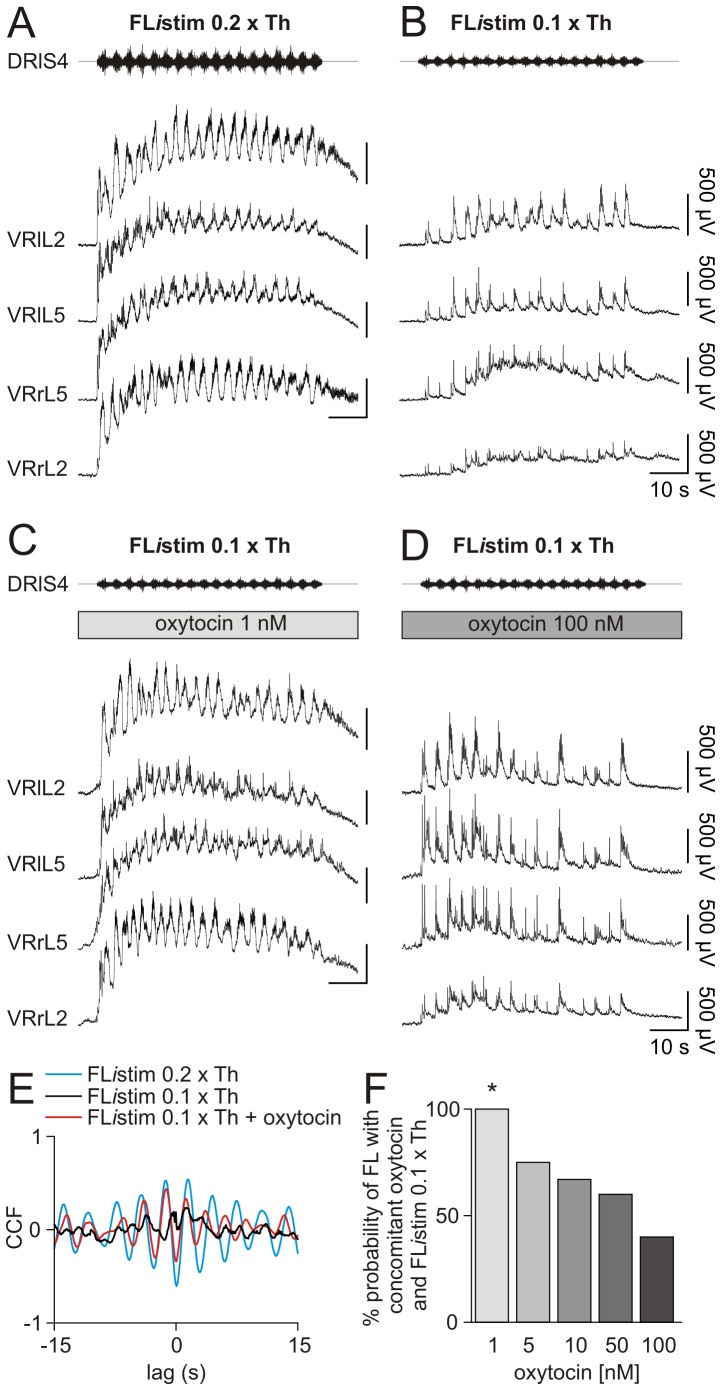
Figure 8. Low nanomolar concentrations of oxytocin synergize with FListim in expressing fictive locomotor patterns.
A, FListim (0.2×Th) generates cumulative depolarization with alternating oscillations among homolateral L2 and L5 VRs and among controlateral homosegmental VRs. When stimulus intensity is halved (0.1×Th), a slight cumulative depolarization with synchronous discharges (time locked with the stimulating pattern) appears among all VRs (B). Despite the weak electrical stimulation (FListim 0.1×Th), the addition of low concentration of oxytocin (1 nM) re-establishes cumulative depolarization and FL cycles (C). Increased concentration of oxytocin (100 nM) fails to synergize with the same FListim 0.1×Th (D). Cross correlation analysis for traces related to the pair of L2 VRs in A–C shows a negative peak centered around zero lag for suprathreshold FListim (blue trace) or subthreshold FListim plus 1 nM oxytocin (red trace). The weak FListim alone (black trace) has a CCF value close to zero, corresponding to an uncorrelated activity among the two VRs (E). F, histograms show that, by increasing the concentration of oxytocin, the probability of bringing FL to threshold with a weak FListim diminishes in a dose dependent manner (*; Chi-square vs FListim 0.1×Th alone; P = 0.005; n = 8).

