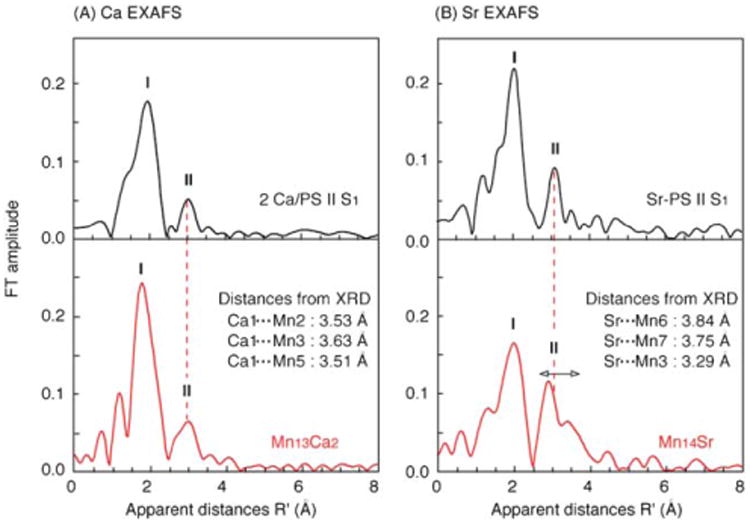
Fig. 5.

(A) Fourier transforms of the Ca EXAFS spectra of the Mn13Ca2 complex 1 (red) and PS II S1 state (black),4 and (B) Fourier transforms of the Sr EXAFS spectra of the Mn14Sr complex 2 (red) and Sr-reconstituted PS II S1 state (black).5 Note that there are two Ca per PS II, including one Ca extraneous to the OEC. Also, note that the apparent distances (R′) of the FT peaks are shorter by ∼0.5 Å compared to the actual distances due to a phase shift induced by the potentials of the absorber–backscatterer pair on the photo-electron. The distances in the inset are from the X-ray crystal structures (XRD).
