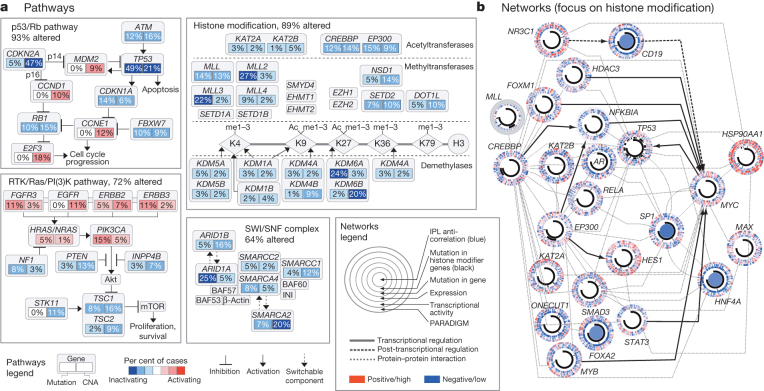
Figure 4. Altered pathways and networks in bladder cancer.
a, Somatic mutations and copy number alterations (CNA) in components of the p53/Rb pathway, RTK/RAS/PI(3)K pathway, histone modification system and SWI/SNF complex. Red, activating genetic alterations; blue, inactivating genetic alterations. Percentages shown denote activation or inactivation of at least one allele. b, The network connecting mutated histone-modifying genes to transcription factors with differential activity (methodology and larger implicated network in Supplementary Fig. 8.2.1). Each gene is depicted as a multi-ring circle with various levels of data, plotted such that each ‘spoke’ in the ring represents a single patient sample (same sample ordering for all genes). ‘PARADIGM’ ring, bioinformatically inferred levels of gene activity (red, higher activity); ‘Transcriptional activity’, mean mRNA levels of all of the targets of each transcription factor; ‘expression’, mRNA levels relative to normal (red, high); ‘Mutation in gene’, somatic mutation; ‘Mutation in histone modifier genes’, somatic mutation in at least one such gene; ‘IPL anti-correlation’, genes with PARADIGM integrated pathway levels (IPLs) inversely correlated with histone-gene mutation status. Gene–gene relationships are inferred using public resources.

