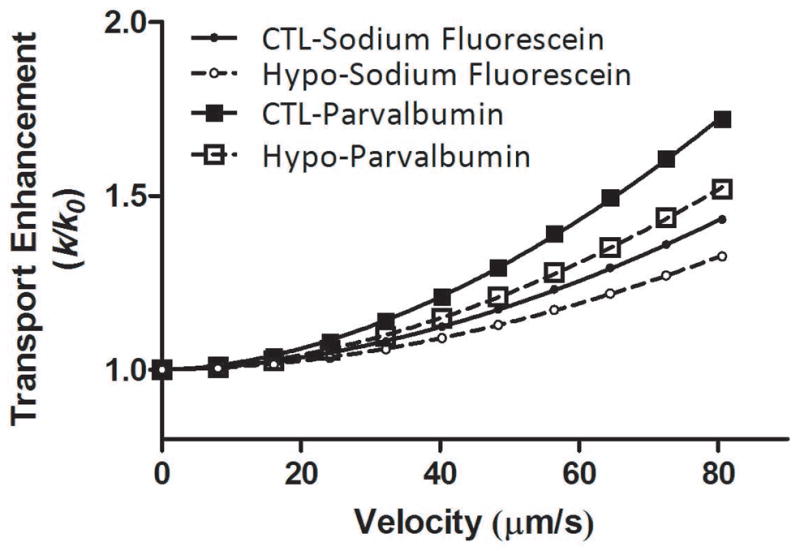
Figure 3.

Simulated transport enhancement as a function of solute velocity for the 12–13 month-old CTL and Hypo bone LCS, using their custom three-compartment transport models. The transport enhancement followed a power relationship with the solute velocity in both CTL (solid lines) and Hypo bones (dashed lines) and for sodium fluorescein (smaller circles) and parvalbumin (larger squares). Detailed relationships can be found in text (Equations 4–7). For a given solute velocity, the transport enhancement is inversely related to the solute diffusivity. The magnitudes of transport enhancement are thus ordered (from the least to highest) as sodium fluorescein in Hypo LCS, sodium fluorescein in CTL LCS, parvalbumin in Hypo LCS, and parvalbumin in CTL LCS.
