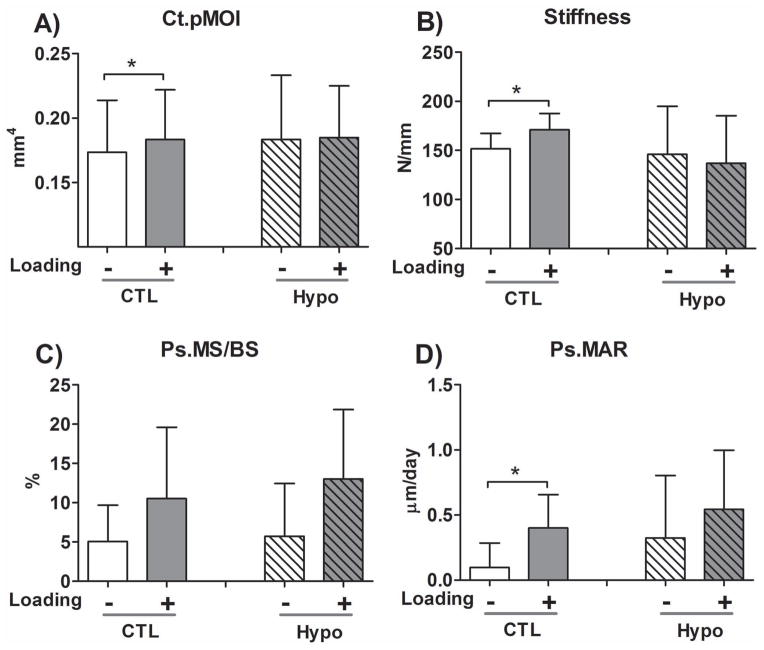
Figure 5.
The 3.5-month-old Hypo mice did not respond to anabolic tibial loading (8.5N peak load, 4 cycles/s, 5 min per session, 5 sessions over 10 days) as did the age-matched CTL mice in a preliminary experiment. (A) Cortical bone polar moment inertia (Ct.pMOI); (B) tibial stiffness; (C) Periosteal mineralizing surface (Ps.MS/BS); and (D) Periosteal mineral apposition rate (Ps.MAR). Sample sizes: N=8 CTL and N=6 Hypo mice for micro-CT analysis; N=7 CTL and N=6 Hypo mice for mechanical testing and bone labeling analyses. Despite the inter-animal variations within CTL or Hypo groups, Student’s t-tests on the non-loaded vs. loaded paired tibiae revealed significant changes (p<0.05, denoted by * symbols) in CTL mice but not in Hypo mice. A full data set with other histomorphometry parameters and detailed p values of statistical tests can be found in Table 1S in the Supplementary Materials.

