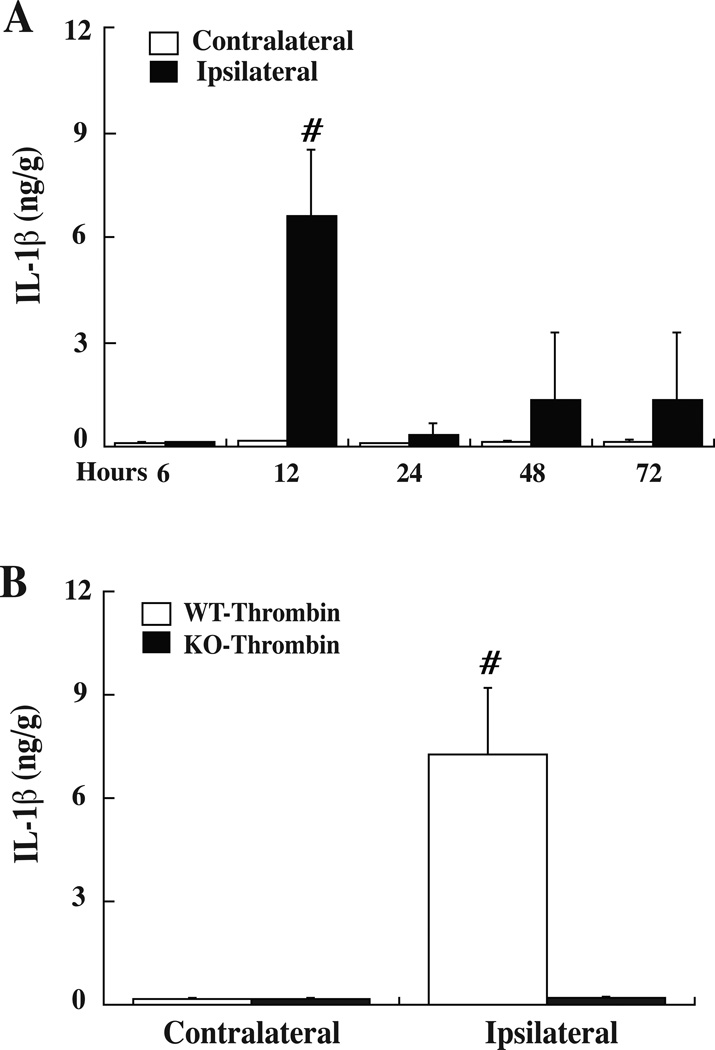
Figure 2.
(A) IL-1β protein levels in the basal ganglia of WT mice after intracerebral injection of thrombin (0.5 U). Values are mean ± SD, n= 6, #p<0.01 versus the contralateral side and the other time points. (B) IL-1β protein levels in the basal ganglia of WT and PAR-1 KO mice at 12 hours after thrombin injection. Values are mean ± SD, n=5, # p<0.01 versus PAR-1 KO mice.

