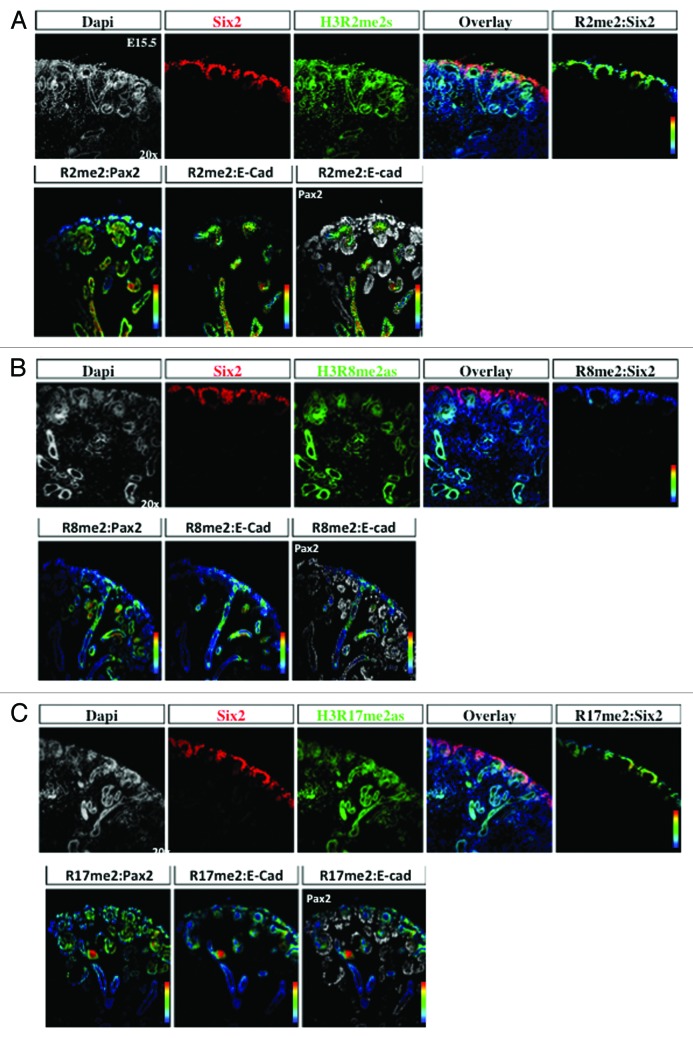
Figure 10. Differential distribution of histone H3 arginine methylation marks in the developing kidney. The cap mesenchyme, marked by Six2 and Pax2, and epithelial structures including UB branches, marked by Pax2 and E-cadherin, were co-stained with H3R2me2s (A), H3R8me2as (B), or H3R17me2as (C) and analyzed at 20×. RGB overlay and pseudocolor images demonstrate co-localization of H3R2me2 and H3R17me2 with Pax2 and Six2 in the cap mesenchyme, and H3R8me2 with Pax2 and E-cadherin in UB structures.

An official website of the United States government
Here's how you know
Official websites use .gov
A
.gov website belongs to an official
government organization in the United States.
Secure .gov websites use HTTPS
A lock (
) or https:// means you've safely
connected to the .gov website. Share sensitive
information only on official, secure websites.
