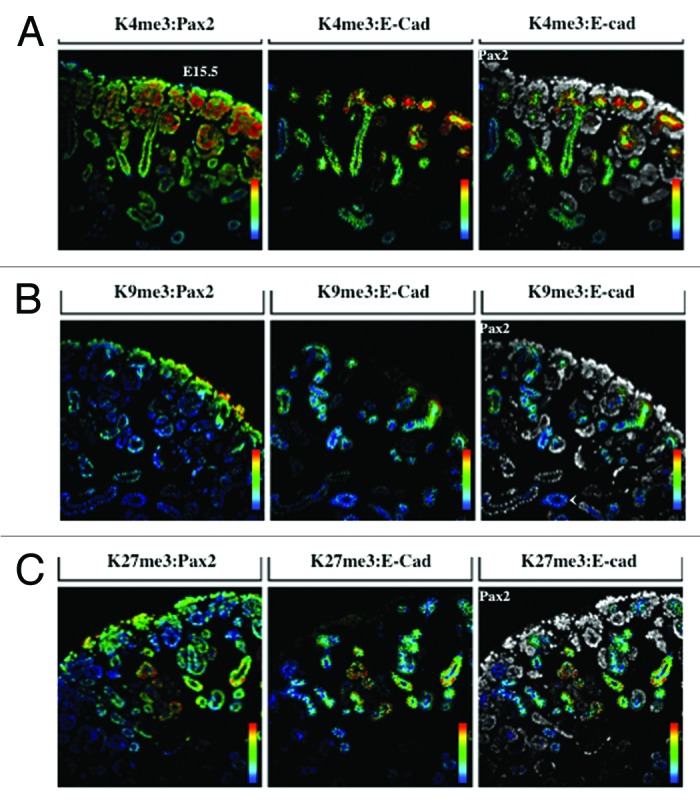
Figure 5. Distribution of H3K4me3, H3K9me3, and H3K27me3. The ureteric bud, cap mesenchyme, and nascent nephrons are marked by Pax2 (blue); ureteric bud structures and epithelial tubules are marked by E-cadherin (red); co-staining was performed with H3K4me3 (A), H3K9me3 (B) or H3K27me3 (C) (green) and analyzed at 20×.
