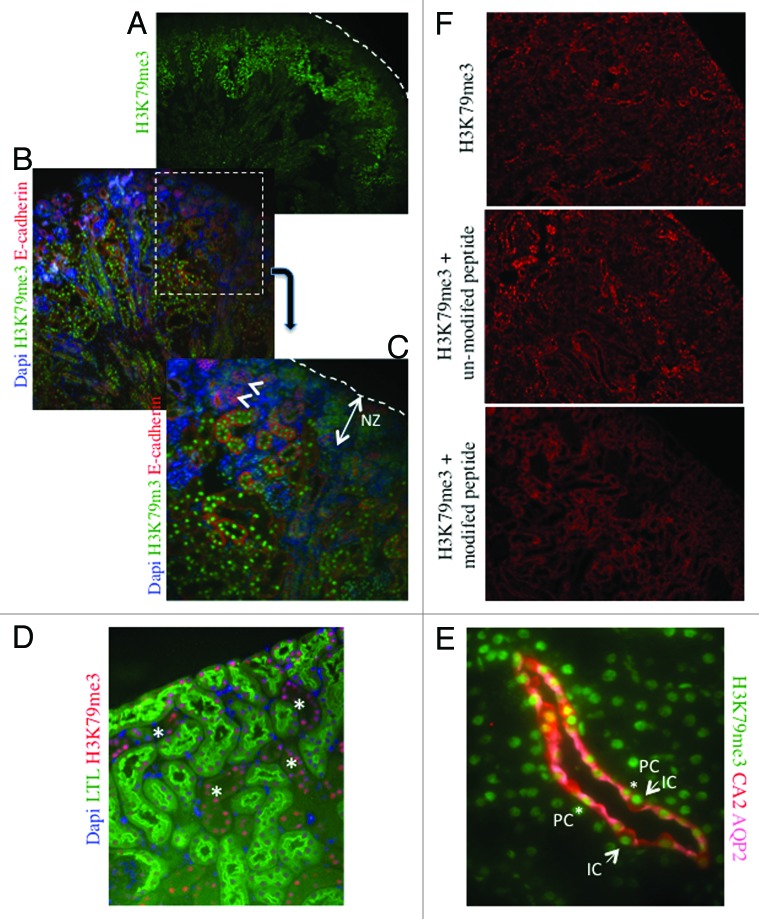
Figure 7. H3K79me3 is enriched in differentiating tubular epithelial cells at postnatal day 1. (A) Low power view (×4). Dotted line indicates the renal capsule. (B and C) Low (×10) and high (×40) power views of the renal cortex showing a progressive increase in H3K79me3 in differentiating E-cadherin+ tubules. The nephrogenic zone and nascent nephrons (arrowheads) are almost devoid of H3K79me3. (D) Low power view (×10) of the renal cortex in an adult kidney. LTL marks the proximal tubules. H3K79me3 is enriched in both proximal and non-proximal tubules. (E) Co-staining for H3K79me3, carbonic anhydrase-2 (CA2, a marker of intercalated cells), and aquaporin-2 (AQP-2, a marker of principal cells). Magnification ×60. (F) Low power view (×10) of the renal cortex in an adult kidney sections incubated with H3K79me3 antibody alone, H3K79me3 antibody + unmodified H3 N-terminal peptide, or H3K79me3 antibody + H3 K79me3 modified peptide. The specific nuclear staining is absent in the section incubated with the modified peptide.

An official website of the United States government
Here's how you know
Official websites use .gov
A
.gov website belongs to an official
government organization in the United States.
Secure .gov websites use HTTPS
A lock (
) or https:// means you've safely
connected to the .gov website. Share sensitive
information only on official, secure websites.
