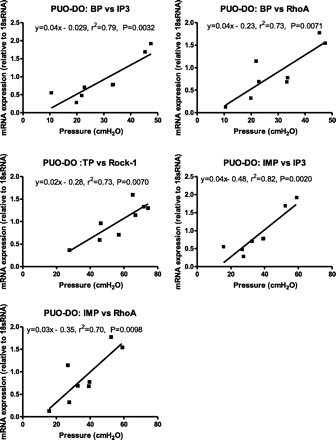
Fig. 9.

Correlation of mRNA expression to pressure parameters obtained via urodynamics 2 wk postobstruction. Nonlinear regression reveals a significant relationship of threshold pressure (TP) to Rock 1, and basal pressures (BP) and intermicurition pressures (IMP) correlate with both RhoA and IP3. P < 0.05 in all cases.
