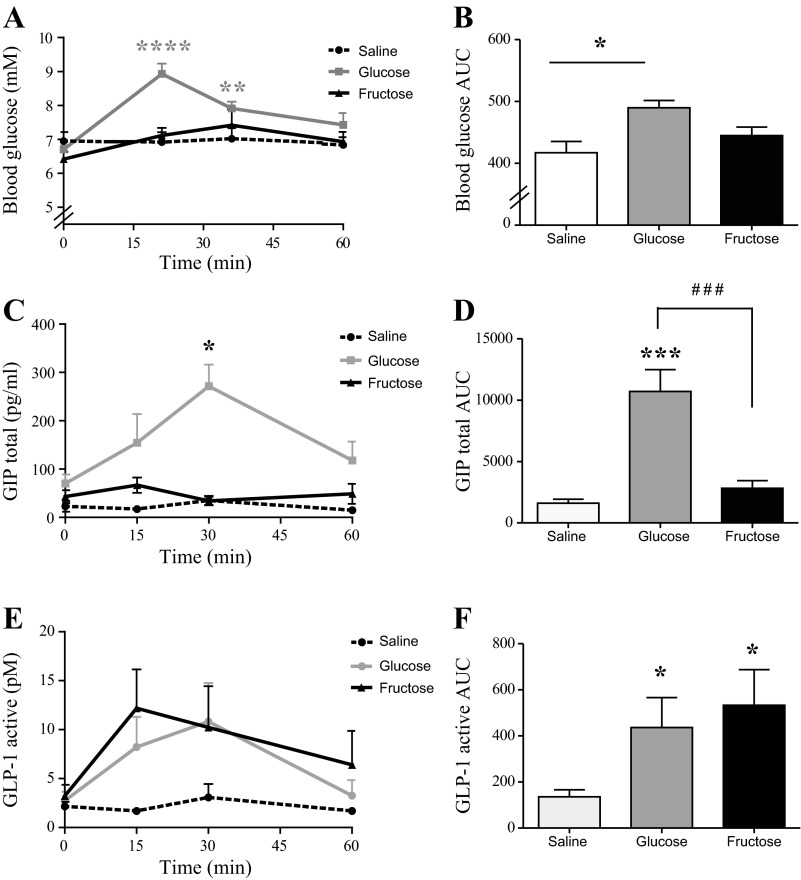
Fig. 3.
Blood glucose and plasma GLP-1 and GIP responses to oral glucose and fructose stimulation in the rat. Mean values + 1 SE are shown in response to oral glucose (gray), fructose (blue), and saline (black) intake. A: blood glucose levels; B: blood glucose AUC levels (min × mM); C: plasma GIPtotal levels (pg/ml); D: plasma GIPtotal AUC values (min × pg/ml); E: plasma GLP-1active concentrations (pM); F: plasma GLP-1active AUC values (min × pM). Between-group significance was tested by two-tailed paired t-test on AUC values. *Within-group significance. #Between group significance. **P < 0.01, ###/***P < 0.001, *P < 0.05, and ****P < 0.0001 relative to base level, n = 7 for glucose and n = 6 for fructose and saline.

