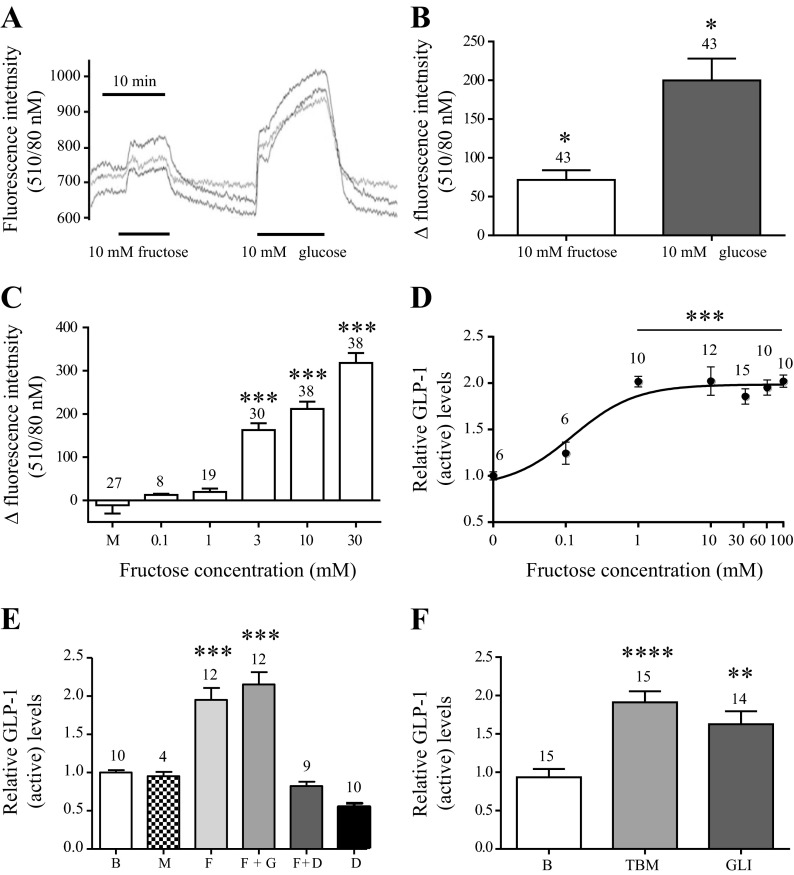
Fig. 5.
Fructose is metabolized by the GLUTag cell and stimulates GLP-1 secretion dose dependently by ATP-sensitive potassium (KATP) channel closure. Data are presented as mean values ± 1 SE with sample size indicated over the respective bars. Responses are shown relative to base level (B) secretion measured in parallel on the same day. A: representative trace of changes in intracellular NAD(P)H levels [fluorescence intensity (340/10 nM)] in response to 10 mM fructose/glucose. Each trace represents one cell. B: collected changes in NAD(P)H levels in response to 10 mM fructose and glucose. C: changes in NAD(P)H levels in response to depicted concentrations series of fructose (F) and mannitol (M) (osmolarity control). D: relative GLP-1active levels in response to concentrations of fructose or as indicated. EC50 = 0.155 mM. E: relative GLP-1active secretion levels in response to mannitol (100 mM), fructose (10 mM), fructose (10 mM) + gliclazide (10 μM) (F + GLI), fructose (10 mM) + diazoxide (340 μm) (F + D), and diazoxide (340 μM) (D). F: relative GLP-1active levels in response to 10 μM tolbutamide (TBM) and gliclazide (GLI). Statistical significance was tested by Student's t-test (B) or one-way ANOVA analysis followed by Bonferroni post hoc test (C–F). *P < 0.05, **P < 0.01, ***P < 0.001, and ****P < 0.0001 relative to base level.

