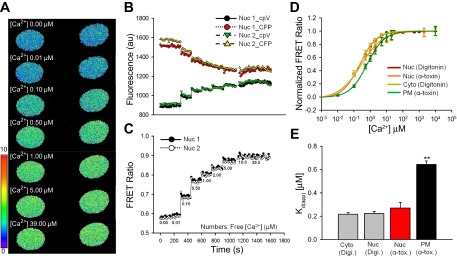
Fig. 2.

In situ calibration of the cameleon D3cpv in the cytoplasm (Cyto), nucleus (Nuc), and plasma membrane (PM) of rat PASMCs. A: original two-dimensional (2D) confocal images of fluorescence resonance energy transfer (FRET) fluorescence of rat PASMCs transfected with 3NLS-D3cpv at various [Ca2+]Free values during the calibration protocol. B: representative traces generated from the nuclei of digitonin-permeabilized rat PASMCs in A showing individual fluorescence intensities of CFP and cpV of 3NLS-D3cpv in the presence of different [Ca2+]Free (as in C), obtained by excitation at 458 nm. C: ratio traces derived from the individual fluorescence intensities of CFP and cpV in B. D: concentration-response curves of the FRET ratio as a function of [Ca2+]Free in the cytoplasm, nucleoplasm, and PM of rat PASMCs. E: apparent dissociation constants for Ca2+ binding (Kd(app)) in the cytoplasm, nucleoplasm, and PM. Digi, digitonin; α-tox, α-toxin. One-way ANOVA was used to calculate the P values.**P < 0.001.
