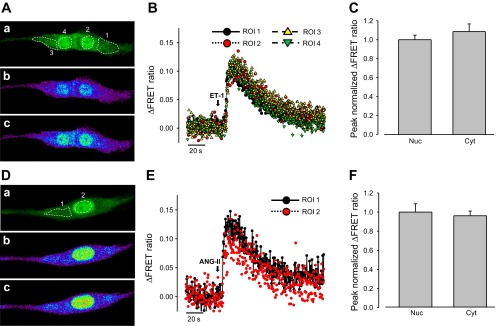
Fig. 5.

Effects of ET-1 and ANG II on the nucleoplasmic and cytoplasmic Ca2+ increase in rat PASMCs. A: 2D confocal images of a PASMC cotransfected with D3cpv and 3NLS-D3cpv, showing cpV fluorescence (a), and Ca2+ mobilization in the cytoplasm and nucleoplasm before (b) and after (c) ET-1 (30 nM) treatment. B: ΔFRET fluorescence ratio traces showing Ca2+ mobilization in the cytoplasm (ROI 1 and 3) and nucleoplasm (ROI 2 and 4) of rat PASMCs (from A) after ET-1 treatment. C: statistical analysis of the peak normalized ΔFRET fluorescence ratio of ET-1 induced Ca2+ transients in the nucleoplasm and cytoplasm of rat PASMCs. One-way ANOVA was used to calculate P values. P > 0.05; n = 10. Error bars denote SE. D: 2D confocal images of a PASMC cotransfected with D3cpv and 3NLS-D3cpv, showing cpV fluorescence (a), and Ca2+ mobilization in the cytoplasm and nucleoplasm before (b) and after (c) ANG II (100 nM) treatment. E: ΔFRET fluorescence ratio traces showing Ca2+ mobilization in the cytoplasm (ROI 1) and nucleoplasm (ROI 2) of rat PASMCs (from D) after ANG II treatment. F: statistical analysis of the peak normalized ΔFRET fluorescence ratio of ANG II-induced Ca2+ transients in the nucleoplasm and cytoplasm of rat PASMCs. One-way ANOVA was used to calculate P values. P > 0.05; n = 12. Error bars denote SE.
