
Fig. 6.
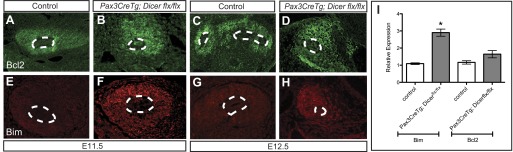
Immunofluorescent staining demonstrates increased Bim and unchanged Bcl2 expression in the metanephric mesenchyme of Pax3CreTg, Dicerflx/flx E11.5 and E12.5 kidneys. A–D: Bcl2 staining in control (A and C) and Pax3CreTg, Dicerflx/flx kidneys (B and D) is unchanged at E11.5 and E12.5. E–H: Bim staining in Pax3CreTg, Dicerflx/flx kidneys (F and H) is increased at E11.5 and E12.5 compared with controls (E and G). The magnification is ×20. I: quantitative real-time PCR performed on total RNA isolated from E11.5 kidneys confirms increased expression of Bim (*P < 0.05, paired t-test) and no significant difference in Bcl2 expression (P > 0.05, paired t-test). The relative expression of Bim and Bcl2 denotes the fold-change in ΔCT in mutants normalized to controls. Bars represent SE.