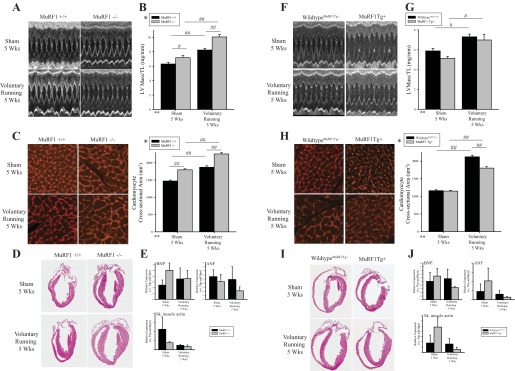
Fig. 7.

MuRF1 regulates physiological cardiac hypertrophy induced by exercise training in MuRF1−/− and MuRF1 Tg+ mice in vivo. MuRF1−/−, MuRF1 Tg+, and sibling-matched wild-type control mice (MuRF1+/+, wild-typeMuRF1Tg+) were assigned randomly to either sedentary or running groups, where running groups were provided with an in-cage exercise wheel for 5 wk and sedentary groups were not. Cardiac growth and function were measured by echocardiography. A: representative M-mode images, containing at least 10 waveforms, from echocardiography of sedentary and running MuRF1+/+ and MuRF1−/− mice. B: left ventricular (LV) mass measurements, as measured by echocardiography, normalized to tibia length (TL) for MuRF1+/+ and MuRF1−/− mice assigned to either sedentary or running groups were also analyzed. C: perfused and fixed paraffin-embedded heart sections from sedentary and running MuRF1−/− and wild-type control mice were stained with lectin-TRITC, imaged using fluorescent microscopy to visualize cardiomyocytes, and cross-sectional area was analyzed from >180 cardiomyocytes from ≥3 animals/group. D: histological analysis of hemotoxylin and eosin was also performed. E: RNA was isolated from whole heart tissue from sedentary and running MuRF1+/+ and MuRF1−/− cDNA generated, and brain natriuretic peptide (BNP), atrial natriuretic peptide (ANF), smooth muscle (sm) actin, TATA box-binding protein (Tbp), and hypoxanthine phosphoribosyltransferase (Hprt) expression were determined, where both Tbp and Hprt were used as reference genes. Raw CT values were normalized to the average CT value over all groups within each genotype pair to calculate ΔCT values. ΔCT values for each animal were then divided by their respective reference gene correction factor (geometric mean of Tbp and Hprt ΔCT values) to obtain final expression data for target genes (BNP, ANF, and sm actin). Three animals (n = 3) per group were used. A 2-way ANOVA test was used to determine statistical significance. F: representative M-mode images, containing at least 10 waveforms, from echocardiography of sedentary and running MuRF1 Tg+ and wild-typeMuRF1Tg+. G: LV mass measurements, as measured by echocardiography, normalized to TL for MuRF1 Tg+ and wild-typeMuRF1Tg+ mice assigned to either sedentary or running groups were also analyzed. H: perfused and fixed paraffin-embedded heart sections from sedentary and running MuRF1 Tg+ and wild-typeMuRF1Tg+ control mice were stained with lectin-TRITC, imaged using fluorescent microscopy to visualize cardiomyocytes, and cross-sectional area was analyzed from >180 cardiomyocytes from ≥3 animals/group. I: histological analysis of hemotoxylin and eosin was also performed. J: RNA isolated from whole heart tissue from sedentary and running wild-typeMuRF1Tg+, MuRFTg+ mice cDNA was generated, and BNP, ANF, sm actin, Tbp, and Hprt expression was determined, where both Tbp and Hprt were used as reference genes (as described above). A 2-way ANOVA test was used to determine statistical significance. *Significance on level of genotype group; **significance on level of exercise (sedentary or running) group; %significant interaction between genotype and exercise groups. The F statistic and DF were reported when dependence between groups was found to be a significant source of variation. #P < 0.05 and ##P < 0.001, significance between groups as determined using a pairwise posttest.
