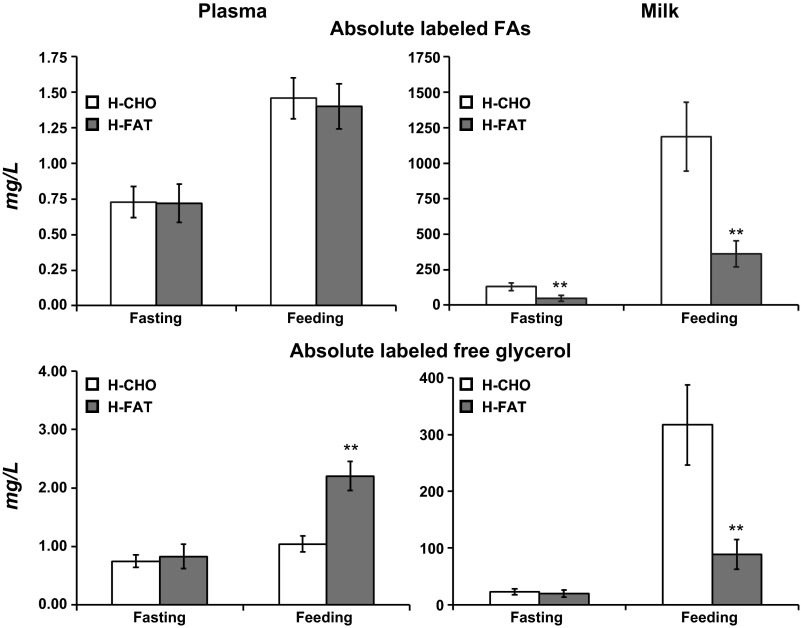
Fig. 4.
Absolute amount of sum of labeled FA (top; as calculated by multiplying the enrichment of M+2 FAs times their concentrations) and free glycerol (bottom; as calculated by multiplying the enrichment of M+3 glycerol times its concentration) in plasma and milk following overnight fast and during feeding of H-CHO and H-FAT diets. Note the y-axis in the right is 1,000 (top) and 100 (bottom) times that in the left. Values are means ± SE; n = 7. Significantly different from H-CHO (paired t-test): **P < 0.01.

