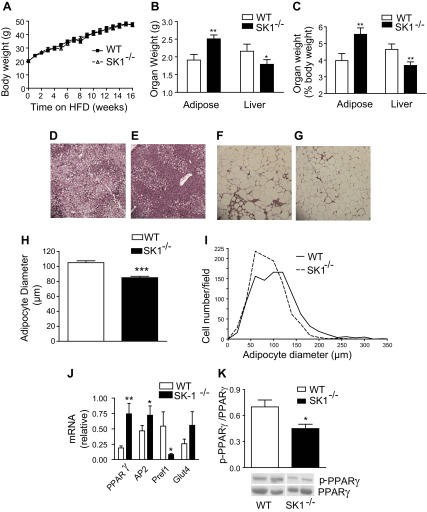
Fig. 2.
SK1 regulates adiposity and steatosis. A: body and organ weights (B and C) of male wild-type (WT) and SK1−/− mice fed a HFD for 16 wk. For A–C, n = 10 ± SD. D–G: hematoxylin and eosin-stained sections of liver (D: WT; E: SK1−/−) and EAT (F: WT; G: SK1−/−) of HFD fed mice. H and I: adipocyte diameter distribution of adipocyte size in EAT of HFD-fed WT and SK1−/− mice. J: gene expression of adipogenic markers in adipocyte cultures from adipose tissue SVF 12 days postdifferentiation. K: Western blot of adipose PPARγ phosphorylation on Ser112 (top) and non-phospho-PPARγ (bottom); n = 6 ± SD. The bands of WT and SK1−/− in the Western blot are from the same blot and at the same exposure level. The separating white space denotes membrane splicing for clear presentation. *P < 0.05, **P < 0.01 WT vs. SK1−/−.

