
Fig. 9.
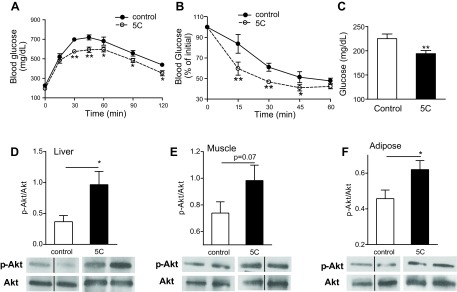
Pharmacological inhibition of SK1 improves insulin sensitivity. GTT (A), ITT (B), and fasting glucose levels (C) in DIO WT mice treated daily for 3 days with specific SK1 inhibitor 5c (2 mg/kg ip) or with vehicle control. Insulin-mediated Akt phosphorylation in liver (D), muscle (E), and EAT (F) of control and 5c-treated DIO mice. The bands of vehicle and 5c-treated DIO WT mice in the Western blot are from the same blot and at the same exposure level. D–F, bottom: same blot stripped and reprobed with anti-Akt. Black line between some of the bands indicates noncontiguous lanes. The separating white space between control and 5c-treated samples denotes membrane splicing for clear presentation; n = 6 ± SD. *P < 0.05 and **P < 0.01, 5c vs. control.