Fig. 2.
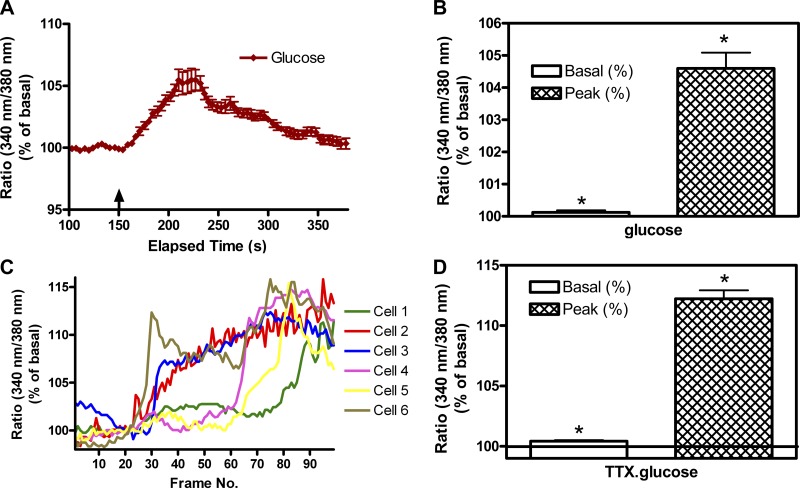
Effect of increasing glucose on intracellular Ca2+ concentration ([Ca2+]i) in SON neurons. A: time course of change in 340-to-380 (340:380) ratio indicative of change in [Ca2+]i induced by increasing the glucose concentration from 0.5 to 5 mM. Values shown are means ± SE of 18 SON neurons imaged simultaneously in a single hypothalamo-neurohypophyseal system (HNS) explant. B: peak increase in the 340:380 ratio in response to the addition of glucose in 34 neurons imaged in 2 HNS explants. Values are means ± SE, *P ≤ 0.001 by signed rank test between basal and peak response. C: time course of individual neuronal responses to increasing glucose (from 0.5 to 5 mM) in the presence of tetrodotoxin (TTX, 3 μM). In this preparation, the responses were not tightly temporally synchronized as in A. This could reflect neurons at different depths within the preparation. D: peak increase in the 340:380 ratio in response to the addition of glucose in 40 neurons imaged in 2 HNS explants. Values are means ± SE, *t = 17.500, P ≤0.001, basal to peak response.

