Fig. 6.
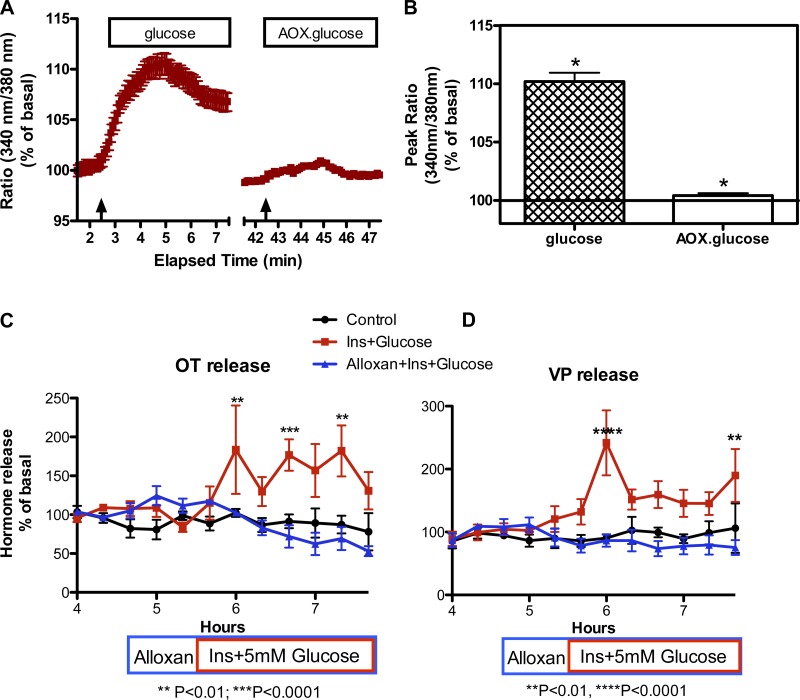
GK dependence of the effects of glucose on [Ca2+]i and Ins + glucose on OT and VP release. A: time course of Ca2+ response to glucose (5 mM) in the presence of 13 mM KCl in the absence (glucose) or presence of alloxan (AOX.glucose; 4 mM AOX). The basal medium contains 0.5 mM glucose. Arrows indicate when glucose was administered. B: comparison of the peak responses under these conditions. Glucose (5 mM) induced an increase in [Ca2+]i in the majority of SON neurons in the presence of 13 mM KCl (to increase resting membrane potential). The response was abolished when cells were pretreated with GK inhibitor AOX (*H = 59.260, P ≤ 0.001). Data were combined from neurons imaged in 2 explants. Total number of neurons = 40. C and D: effect of alloxan on OT and VP release, respectively. Addition of alloxan (4 mM) 1 h before increasing the perifusate glucose and insulin concentrations to 5 mM and 3 ng, respectively, did not alter basal release of OT (198 ± 25 pg/ml) or VP (169 ± 46 pg/ml), but it prevented the increase in OT and VP release induced by the addition of glucose and insulin. **P < 0.01, ***P < 0.0001. n = 6 explants per group.

