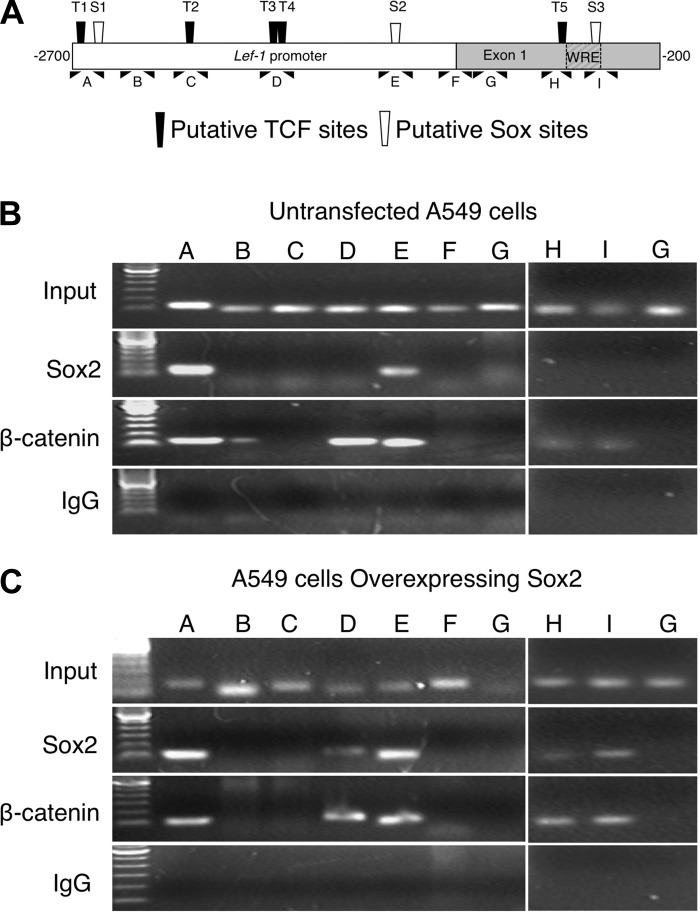
Fig. 5.
ChIP analysis of Sox2 and β-catenin binding sites in the endogenous Lef-1 promoter of A549 cells. A: displayed is a schematic representation of 9 PCR fragments used to survey the Lef-1 promoter by ChIP. Each PCR fragment covered ∼100 bp of the promoter. The location of TCF and Sox consensus sites are marked. B and C: ChIP was performed on untransfected A549 cells (B) or A549 cells transiently transfected with a Sox2 expression construct (C), using Sox2, β-catenin, or nonimmunogenic IgG as the immunoprecipitation antibody. Agarose gels of the PCR products are shown. Lane labels correspond to the PCR region shown in A. Data are representative of 3 independent experiments.

