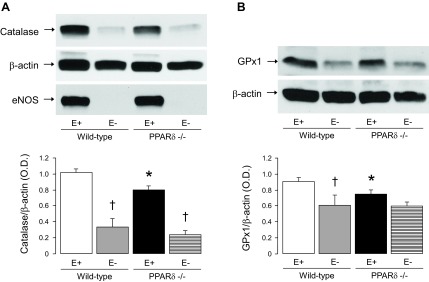
Fig. 10.

Top: representative Western blot analysis of catalase (A) and glutathione peroxidase 1 (GPx-1; B) protein expression in WT littermates and ePPARδ−/− mouse aortas in the presence (E+) or absence (E−) of ECs. Please note that removal of the endothelium eliminated the differences between WT and ePPARδ−/− mice. Successful removal of ECs was confirmed by the absence of eNOS. Bottom: bar graphs showing the results of the relative densitometry compared with β-actin protein. Results are means ± SE; n = 10 for E+ and 4 for E−. *P < 0.05 vs. WT mice; †P < 0.05 vs. E+ (by two-way ANOVA).
