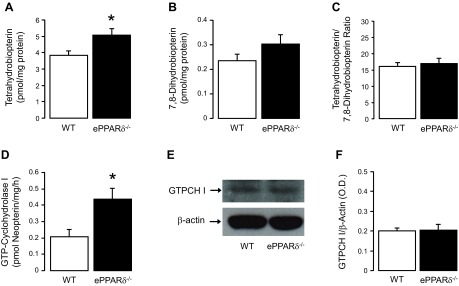
Fig. 6.

Quantitative HPLC analysis of vascular biopterin metabolism in ePPARδ−/− mice. A–D: bar graphs showing tetrahydrobiopterin levels (A; n = 6), 7,8-diydrobiopterin levels (B; n = 6), the ratio of tetrahydrobiopterin to 7,8-diydrobiopterin (C; n = 6), and the enzymatic activity of GTP-cyclohydrolase I (GTPCH I; D; n = 5). E: GTPCH I protein expression (n = 4) in aortas of WT littermates and ePPARδ−/− mice. Please note that the bar graph of GTPCH I protein indicates the results of the relative densitometry compared with β-actin protein (F). All results are shown as means ± SE. *P < 0.05 vs. WT mice.
