Fig. 2.
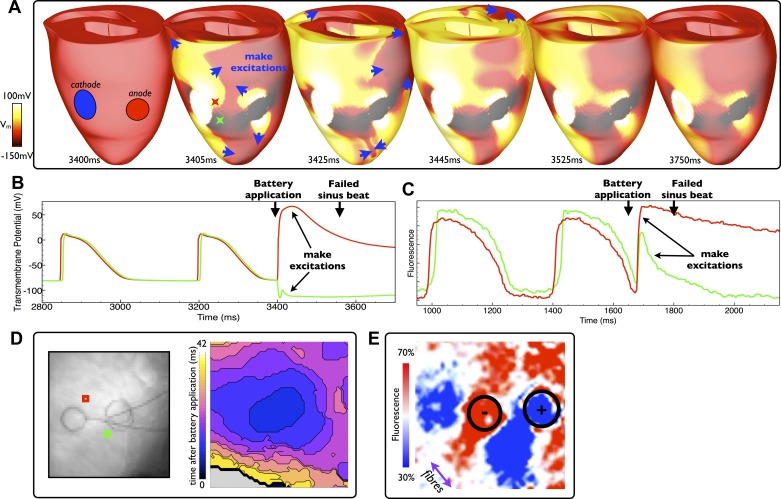
Battery application during diastole. A: epicardial distribution of Vm in the model at different times after battery application (at 3,400 ms) with make excitation wavefront propagation indicated by blue arrows. D: the experimental activation map (right) along with electrode locations (left) of excitation patterns after a similar battery application episode (at 1,680 ms). Stimulus durations were both of relatively long duration: 700 and 500 ms in the model and experiment, respectively. B and C: individual temporal model epicardial Vm (B) and fluorescent signal traces (C) from locations shown by the colored Xs in B (3,405 ms) and squares in D. Make excitation induction is seen immediately after battery application in both the model and experiment, which subsequently excites the rest of the ventricles and causes the next sinus beat to be blocked. After recovery of the tissue from this initation excitation, a static virtual electrode pattern is seen around the ventricles in the model (A, 3,750 ms) and experiment (E). The color bar scale in E is relative to fluorescent intensity of the action potential amplitude recorded during sinus pacing. The approximate fiber orientation is shown by the purple arrow.

