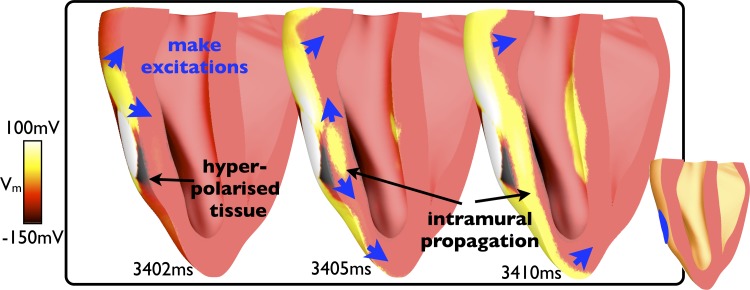
Fig. 3.
Intramural polarization levels and wavefront propagation in battery application during diastole (shown in Fig. 2). Images show Vm levels within the three-dimensional model where a clipping plane (shown in the middle) has been used to expose the intramural tissue state beneath the cathode at different instances in time after battery application (at 3,400 ms).

