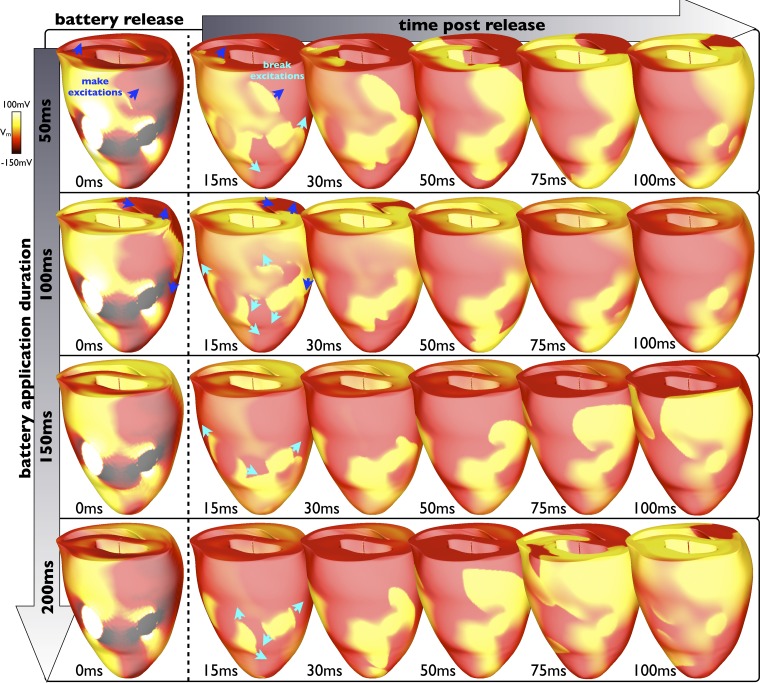
Fig. 7.
Interaction of make and break excitations. Epicardial Vm distributions show the evolution of break excitation wavefronts at different time instances in the first 100 ms (columns) after battery release for different total battery application durations from 50 to 200 ms (rows) when initially applied 200 ms after the previous sinus beat (during diastole). Make excitations are shown by blue arrows; break excitations are shown by turquoise arrows. As the battery is applied for longer (going down the first column), the make excitations induced upon its application have advanced further and the ventricles are progressively more recovered when the battery is released, allowing the subsequent induced break excitations to propagate more freely, thus encountering less refractory tissue.

