
Figure 2.
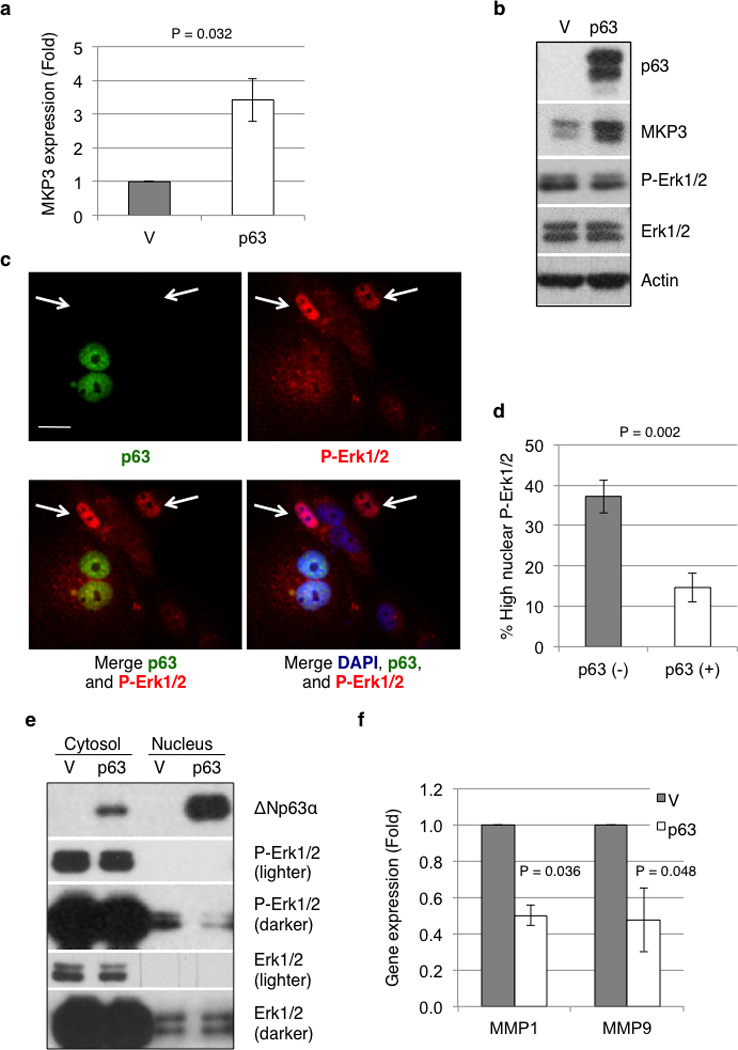
ΔNp63 reduces phosphorylated Erk1/2 in nuclei and attenuates Erk1/2 signaling. MDA-MB-231 cells stably expressing ΔNp63α (p63) or an empty vector control (V) were subjected to Q-PCR analysis for MKP3 mRNA levels (a) and protein expression (b). The Q-PCR data are presented as means and SE from three experiments performed in triplicate (P = 0.032) (c) MDA-MB-231 cells were transduced with retrovirus encoding ΔNp63α. A mixed population of ΔNp63α-positive [p63 (+)] and ΔNp63α-negative [p63 (−)] cells was assessed by immunofluorescence for p63 (green) expression and phosphorylated Erk1/2 (red) levels, and the nuclei were counterstained with DAPI (blue). Arrows denote cells with high levels of nuclear phosphorylated Erk1/2. Scale bar = 20 µm. (d) Cells with high levels of phosphorylated Erk1/2 were scored for both p63 (−) and p63 (+) cells. Data are presented as percentage of cells with high phosphorylated Erk1/2 over total p63 (−) or p63 (+) cells. At least 100 cells in total from five random fields were scored for each of six experiments. Results are presented as means and SE. (e) MDA-MB-231 cells stably expressing ΔNp63α (p63) or vector control (V) were subjected to cellular fractionation to separate the nuclear from the cytosolic fractions, which were then subjected to western blotting as shown. (f) MDA-MB-231 cells stably expressing ΔNp63α (p63) or vector control (V) were subjected to Q-PCR analysis for mRNA levels of MMP1 and MMP9. Results are presented as means and SE from three experiments performed in triplicate.