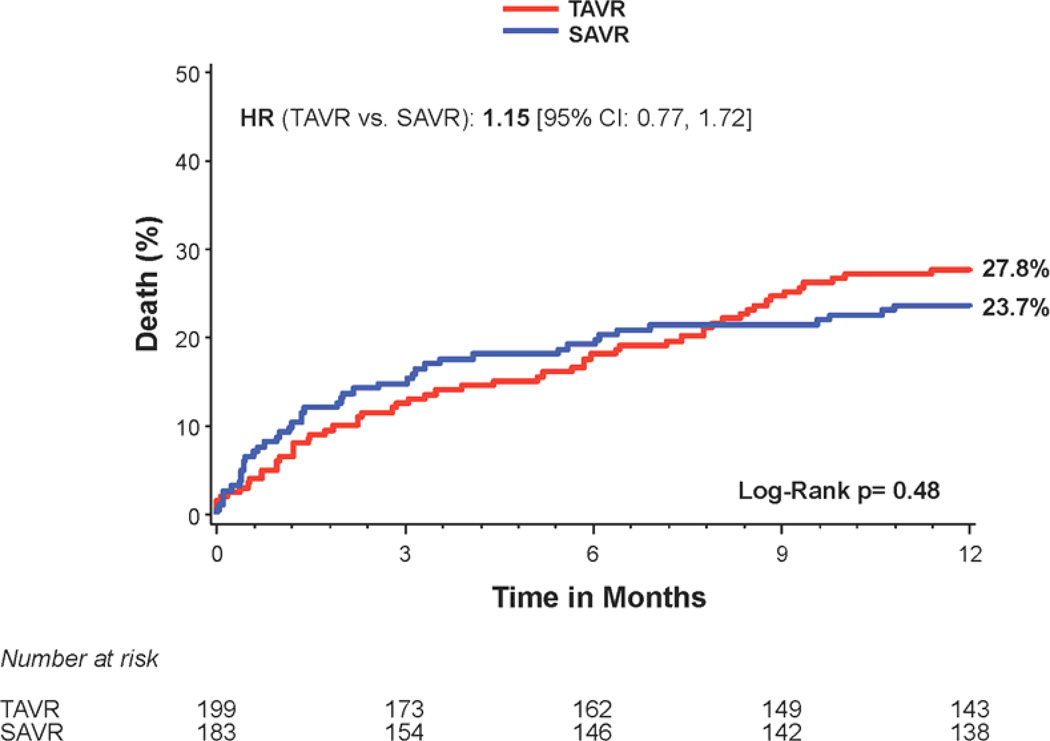
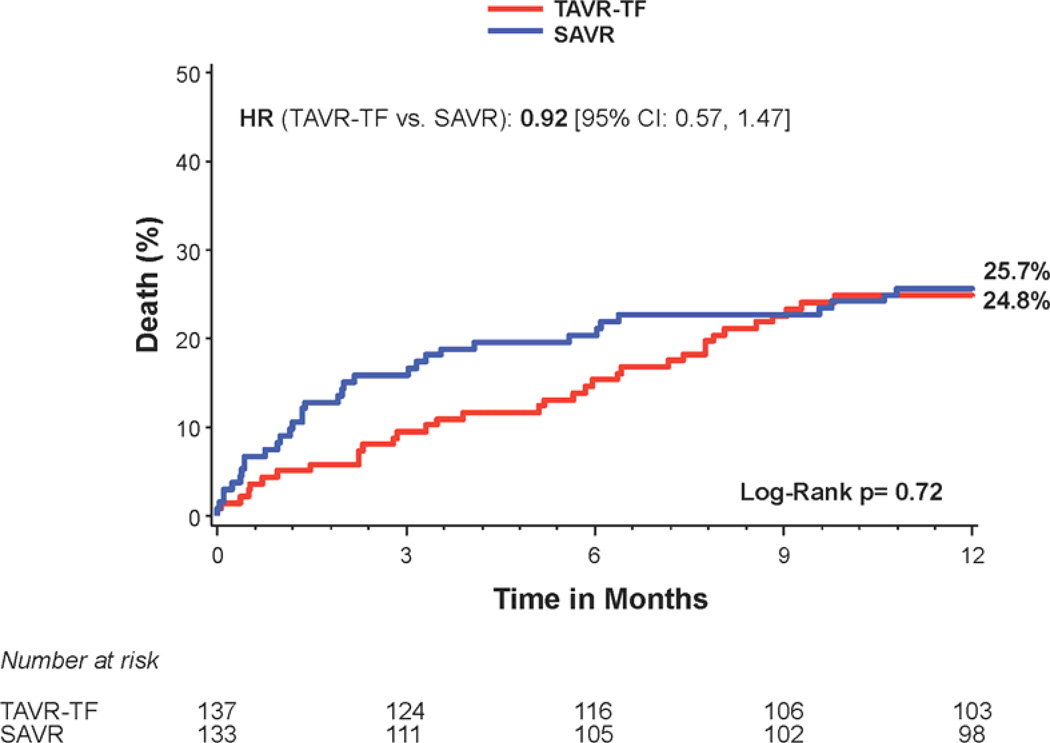
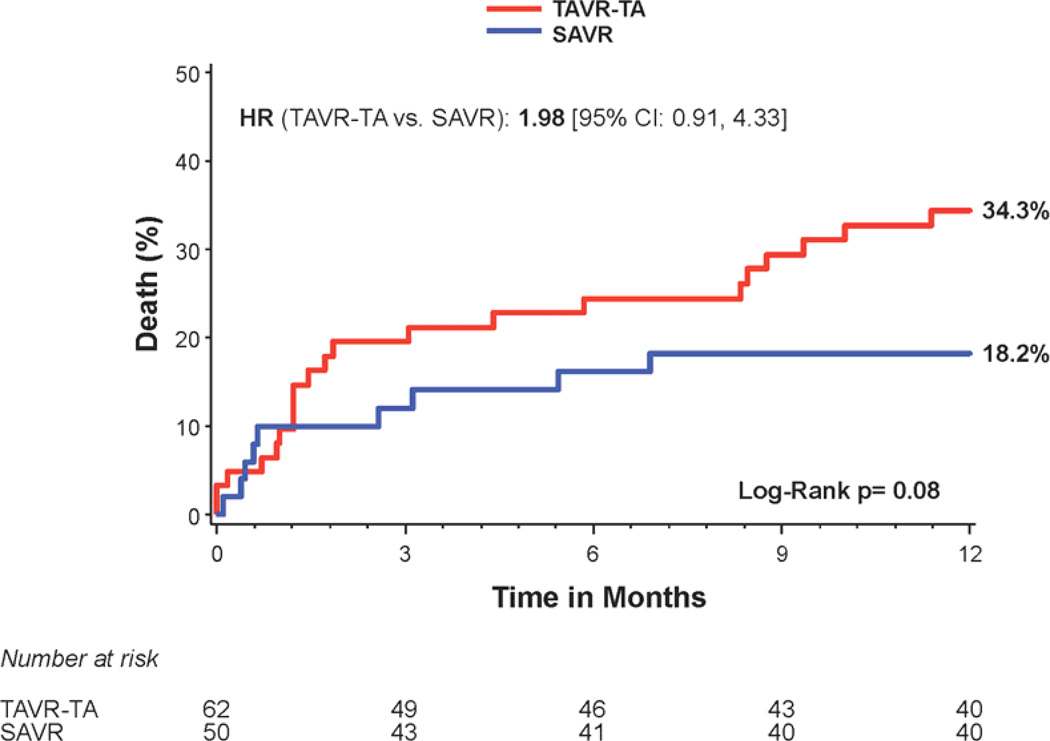
Figure 3. Time-to-event curves for non-diabetic patients for 1-year death from any cause.
One-year time-to-event curves are shown for non-diabetic patients for death from any cause in the as-treated population of the PARTNER trial (treated with either transcatheter aortic valve replacement (TAVR) or surgical aortic valve replacement (SAVR)). The curves are shown for all patients without diabetes (A), those in the transfemoral (TF) cohort (B), and those in the transapical (TA) cohort (C). The event rates were calculated with the use of Kaplan-Meier methods and compared with the use of the log-rank test.


