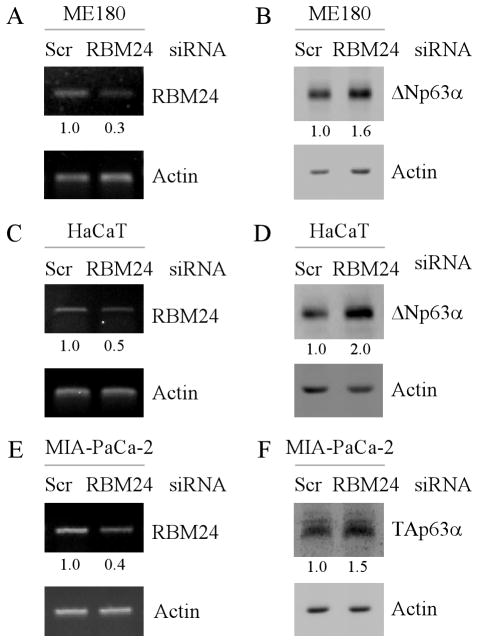
Figure 2. Knockdown of RBM24 increases p63 expression.
(A and C) ME180 (A) and HaCaT (C) cells were transiently transfected with a control or RBM24 siRNA for 72 h, followed by RT-PCR analysis to determine the level of RBM24 and actin transcripts. The level of RBM24 transcript was normalized to that of actin and arbitrary set as 1.0 in control cells. The relative fold changes were shown below each lane. (B and D) ME180 (B) and HaCaT (D) cells were treated as describe in (A), and the level of ΔNp63α and actin proteins was determined by Western blot analysis. The level of ΔNp63α protein was normalized to that of actin protein and arbitrary set as 1.0 in control cells. The relative fold changes were shown below each lane. (E) MIA-PaCa2 cells were transiently transfected with a control or RBM24 siRNA for 72 h and the level of RBM24 and actin transcripts was determined by RT-PCR analysis. (F) RBM24 knockdown increases TAp63α expression. MIA-PaCa2 cells were treated as describe in (E), and the level of TAp63α and actin proteins was determined by Western blot analysis. The level of TAp63α protein and transcript were normalized to that of actin and arbitrary set as 1.0 in control cells. The relative fold changes were shown below each lane.

