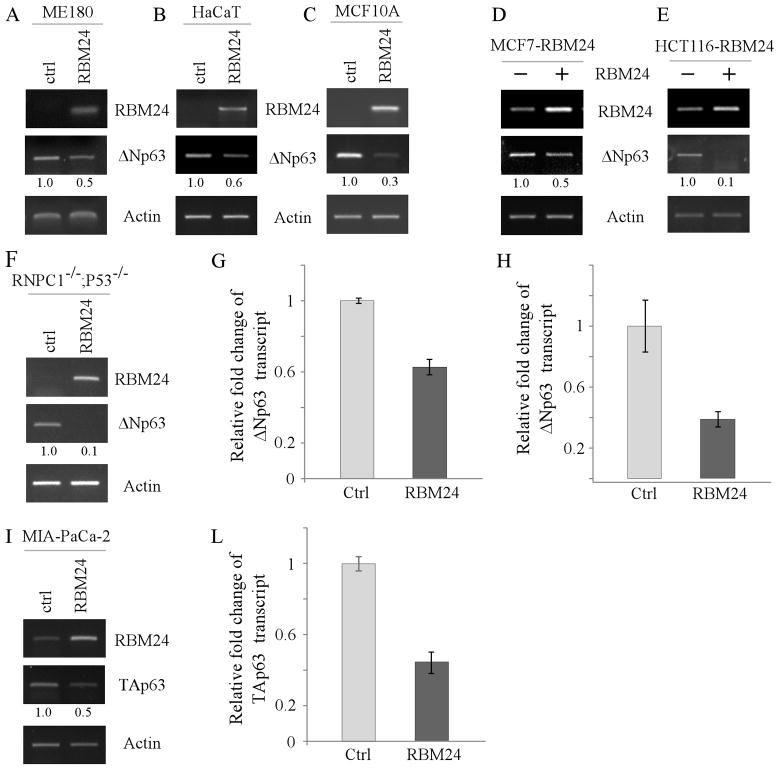
Figure 3. The level of p63 transcript is decreased by ectopic expression of RBM24.
(A–C and F) ME180 cells (A), HaCaT cells (B), MCF10A cells (C), and RBM38−/−;p53−/− MEFs (F) were transiently transfected with a control vector or a vector expressing HA-tagged RBM24 for 48 h. Total RNAs were isolated and subjected to RT-PCR analysis to determine the level of RBM24, ΔNp63, and actin transcripts. The level of ΔNp63 transcript was normalized to that of actin and arbitrary set as 1.0 in control cells. The relative fold changes were shown below each lane. (DE) HCT116 (D) and MCF7 (E) cells were uninduced or induced to express RBM24 for 48 h. Total RNAs were isolated and subjected to RT-PCR analysis to determine the level of RBM24, ΔNp63, and actin transcripts. (G) The level of ΔNp63 transcript in HaCaT cells, which were transfected with a control vector or Rbm24-expressing vector, was measured by quantitative RT-PCR. The level of actin mRNA was measured as an internal control. (H) The experiment was performed as in (G) except that MCF7 cells, which were uninduced or induced to express RBM24, were used. (I–L) MIA-PaCa2 cells were transiently transfected with a control vector or a vector expressing HA-tagged RBM24 for 48 h. Total RNAs were isolated and subjected to RT-PCR analysis (I) or quantitative RT-PCR (L) to determine the level of RBM24, TAp63, and actin transcripts. The level of TAp63 transcript was normalized to that of actin and arbitrary set as 1.0 in control cells. The relative fold changes were shown below each lane.

