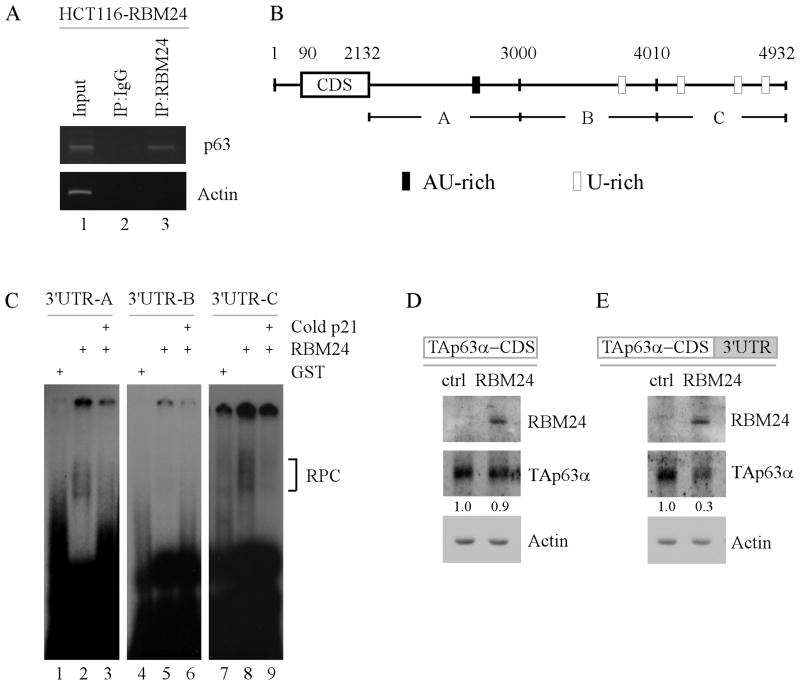
Figure 6. RBM24 binds to multiple regions in the 3′UTR of p63 transcript.
(A) RBM24 associates with p63 transcript in vivo. RBM24-expressing HCT116 cell extracts were immunoprecipitated with a control IgG or RBM24 antibody to bring down the protein-RNA complex. Total RNAs were isolated and subjected to RT-PCR analysis to measure the level of p63 and actin transcripts. Five percent of cell lysate was used as input. (B) Schematic representation of p63 transcript and the location of probes used for REMSA. The AU- or U-rich elements were shown in shaded boxes. (C) RBM24 binds to multiple regions in p63 3′UTR. REMSA was performed by mixing recombinant GST or GST-fused RBM24 protein with 32P-labeled probe A, B, or C. The bracket indicates RNA-protein complexes. For competition assay, unlabeled p21 probe was added to the reaction mix prior to incubation with the 32P-labeled probe A, B, or C. (D-E) The p63 3′UTR is required for RBM24 to inhibit TAp63α expression. TAp63−/− MEF cells were co-transfected with a control or RBM24-expressing vector along with a TAp63α expression vector that contains the coding region alone (D) or in combination with a full-length p63 3′UTR (E). Cell lysates were collected and the level of RBM24, TAp63α, and actin proteins was determined by Western blot analysis. The relative level of TAp63α was normalized to that of actin and arbitrary set as 1.0 in control cells. The relative fold changes were shown below each lane.

