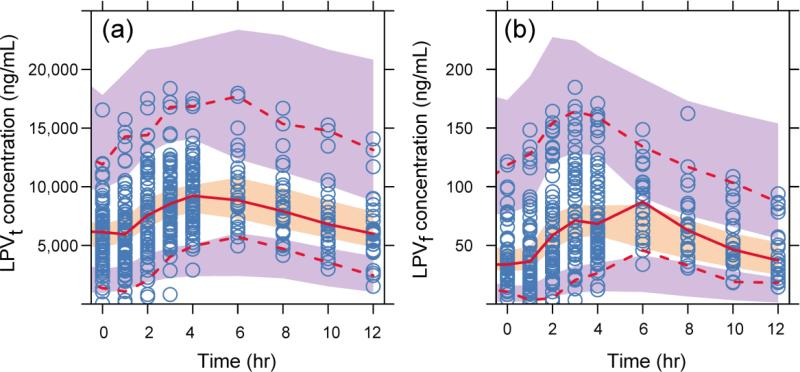
Figure 3.
Prediction corrected visual predictive check of the combined total lopinavir/ritonavir (LPVt/RTV) model (a) and free lopinavir (LPVf) (b). The middle solid line is the median. The dash lines are the 5th and 95th percentiles of observed data. The shaded areas are the corresponding 95% confidence intervals of the simulated data.

