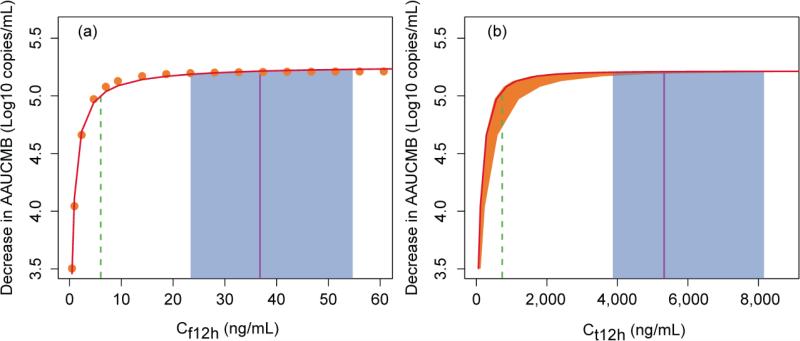
Figure 5.
Relationship between 12 hour steady-state concentrations of free lopinavir (Cf12h) (a), total lopinavir (Ct12h) (b) and exposure [expressed as decrease in area under the viral load-time curve minus baseline (AAUCMB)] at day 7. The symbols and the solid red curve in (a) are the predicted Cf12h and sigmoid Emax fitted line, respectively. The Ct12h was calculated by eq. (5) with Cf12h and α-1-acid glycoprotein (AAG). The solid red curve and shaded orange area around the curve corresponds to the median (range) AAG of 91.8 (23.6-479) mg/dL in (b). The vertical dash green, solid purple line and shaded blue areas are the estimated EC95, observed median and interquartile range of Cf12h and Ct12h at lopinavir/ritonavir 400/100 mg, respectively.

