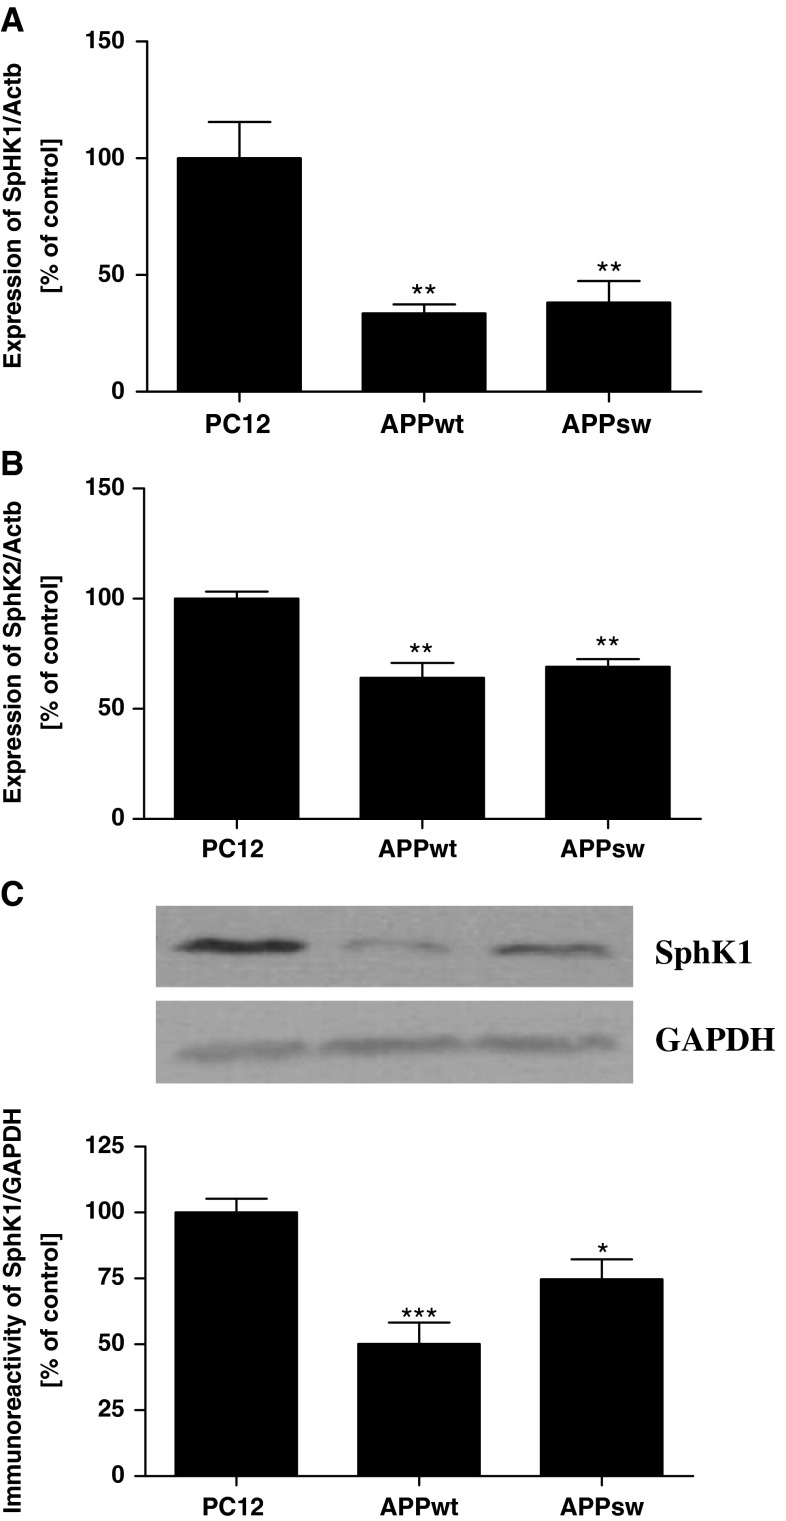
Fig. 1.
Level of mRNA for SphK1 and SphK2 and protein level of SphK1 in APP-transfected cells. Gene expression for SphK1 (a) and SphK2 (b) was measured with real-time PCR. (c) Total level of SphK1 normalized by GAPDH was determined using Western blot analysis. Data represent the mean value ± SEM for six independent experiments carried out in triplicate. **p < 0.01 versus PC12 cells (cells transfected with an empty vector); ***p < 0.001 versus PC12 cells; *p < 0.05 versus PC12 cells, using one-way ANOVA followed by Bonferroni’s Multiple Comparison Test

