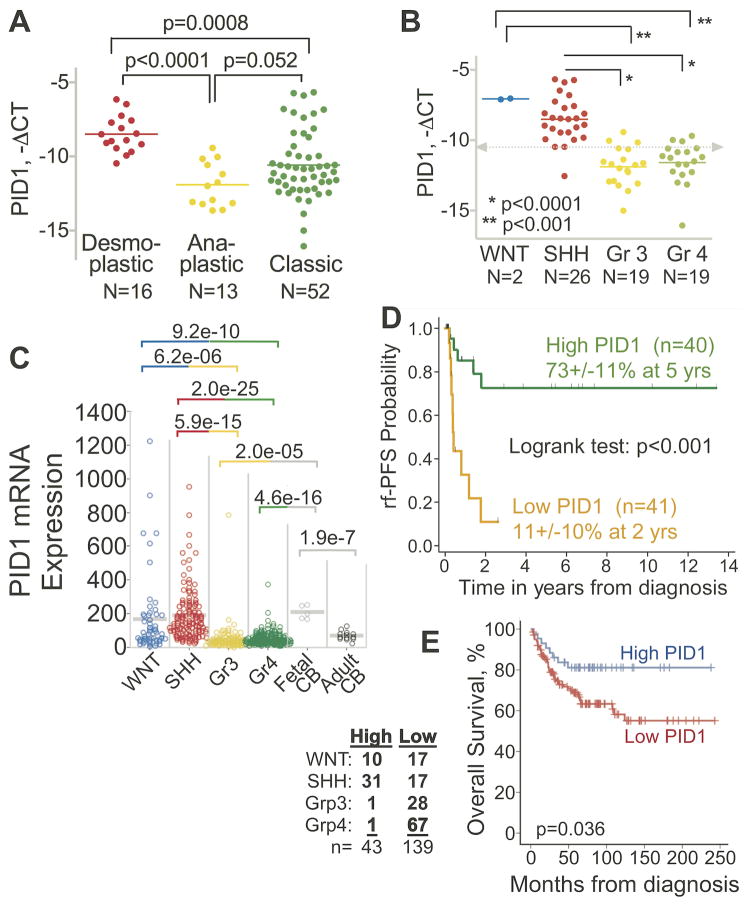
Figure 1. Group 3 and Group 4 medulloblastomas have lower PID1 mRNA than WNT and SHH groups; higher PID1 mRNA correlates with longer rf-PFS and OS in medulloblastomas.
A) Relative mRNA expression (real time qRT-PCR, -ΔCT) of PID1 according to medulloblastoma histology (desmoplastic/nodular, classic, anaplastic) in 81 CHLA patients. B) Relative PID1 mRNA (-ΔCT) of 66 of the tumors described in A for which molecular subgroup classification (WNT, SHH, Group 3, and Group 4) by qRT-PCR was available. Lines depict mean mRNA for each group; grey dashed line represents median PID1 mRNA of all samples. C) PID1 mRNA in medulloblastomas from the Heidelberg series, analyzed on Affymetrix U133 plus2.0, according to molecular classification. This series (n=446) is a combination of published data (11–13) on 230 patients and unpublished data on 216 additional patients from Heidelberg (Kool and Pfister, unpublished data). The medulloblastoma subgroup distribution in this cohort is: 54 WNT, 123 SHH, 98 Group 3, 171 Group 4. These were compared with 5 fetal cerebella and 13 adult cerebella. p-values comparing the groups are listed above the panels and are color-coded according to the groups compared. mRNA values are expressed in arbitrary units, using the MAS5.0 normalized Affymetrix values; D) Radiation-free progression free survival (rf-PFS; Kaplan Meier curve) according to PID1 mRNA (variant 1, NM_017933.4; real time qRT-PCR) in 81 CHLA medulloblastomas. Green curve - patients with above-the-median PID1 mRNA; Orange curve - patients with below-the-median PID1 mRNA. E) Kaplan Meier curve of OS for 182 patients with medulloblastoma from the series shown in panel C for whom OS data were available, plotted according to PID1 mRNA above 100 (High PID1; blue) or below 100 (Low PID1; red). Molecular subgrouping for the tumors of patients in the High PID1 and Low PID1 curves are detailed in the table left of panel.

