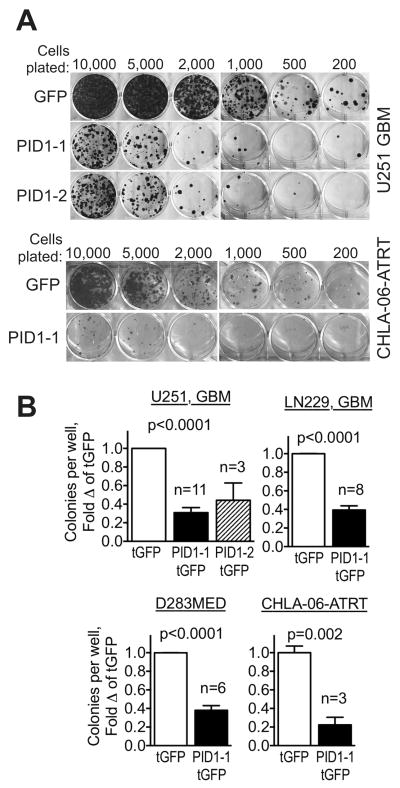
Figure 3. Overexpression of PID1 confers growth inhibition in medulloblastoma, GBM and ATRT cell lines.
A) Colony formation assays of flow-sorted tGFP-expressing U251 GBM and CHLA-06-ATRT cells transiently transfected with pCMV6-AC-tGFP or pCMV6-AC-PID1-tGFP (PID1 variants 1 or 2), seeded at the cell numbers indicated and stained with crystal violet stain after 2 weeks. B) Quantification of colony numbers in replicate experiments performed as in panel A. The number of independent experiments comprising the mean±SEM for each bar is depicted above the PID1 bars. Most experiments were performed in triplicates and the mean of each experiment was considered one value for calculation of the means of the experiments. P-values by Student’s t-test.

