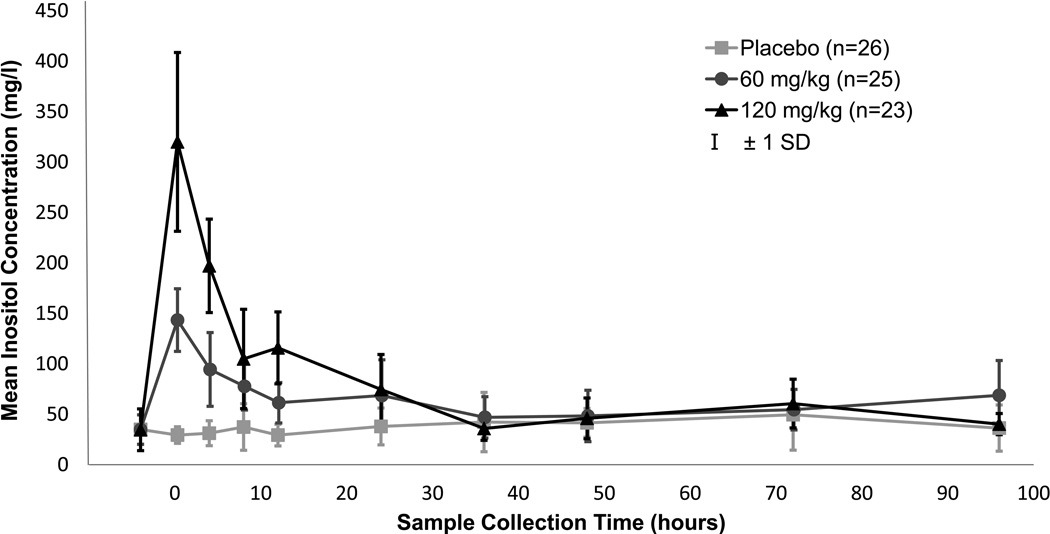
Figure 2. Serum Inositol Levels by Dose Group.
Samples were collected within scheduled windows, plus additional scavenged samples as available. For this graph, collection times were clustered as follows to obtain mean values: 0 h (baseline) = obtained prior to infusion; 0.3 h (end of infusion) = 0–2 h post-infusion; 4 h = 2–6 h post-infusion; 8 h = 6–10 h post-infusion; 12 h = 10–14 h post-infusion; 24 h= 14–30 h post-infusion; 36 h = 30–42 h post-infusion; 48 h = 43–60 h post-infusion; 72 h = 60–82 h post-infusion; 96 h = >82 h post-infusion. Square = placebo, circle = 60mg/kg, triangle= 120mg/kg, vertical bar = ± 1 SD.

