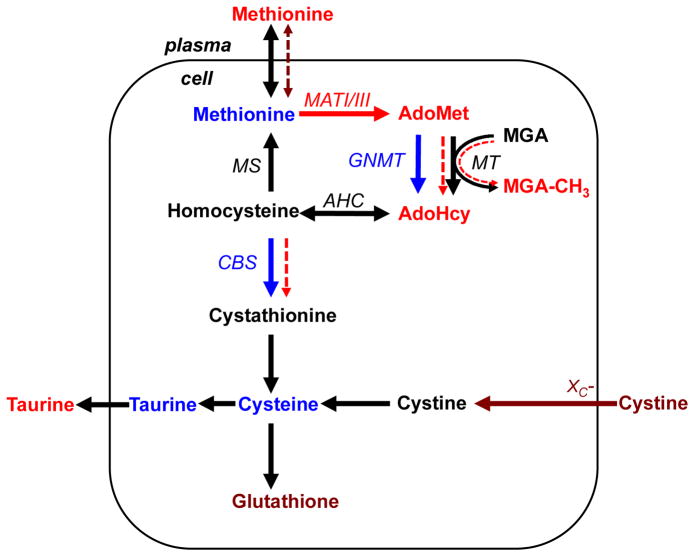
Fig. 4.
Summary of metabolic data obtained in liver of wild-type (DW/J x C3H/HeJ)F2 and Snell dwarf mice. Arrows show enzymatic reactions (metabolic fluxes). The red, maroon and blue colors denote metabolites or enzymes whose levels are increased, decreased, or unchanged, respectively in liver of Snell dwarf mice. Black is used to denote metabolites or enzymes that were not analyzed in this study. The mathematical model reveals (dashed arrows) that changes in sulfur metabolism in Snell dwarf mice can be accounted for by a decrease in membrane permeability to methionine, an increase in functional methyltransferase activity and an increase in the CBS reaction rate (without an increase in CBS activity). The abbreviations used are described in Figure 1 legend with the exception of: MGA-methyl group acceptor, MGA-CH3- methylated methyl group acceptor.

