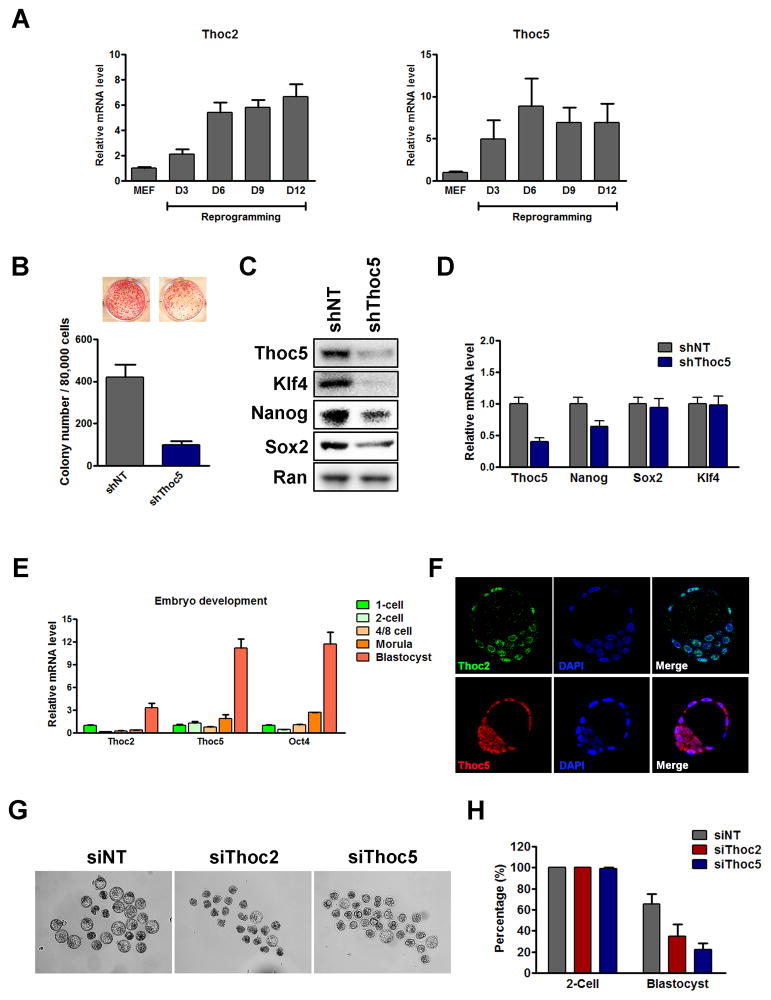
Figure 6. THO depletion inhibits reprogramming and blastocyst development.
(A) Thoc2 and Thoc5 expression during reprogramming as determined by RT-qPCRs. Values are plotted as mean ± SEM from three independent experiments. (B) Effect of Thoc5 KD on reprogramming. MEFs were transduced with NT or Thoc5 shRNA viruses, and then transduced with the OKSM viruses to initiate reprogramming. Number of AP-positive colonies was counted 9 days after the start of the reprogramming, and values are plotted as mean ± SEM from four independent experiments. (C-D) The expression of Thoc5 and pluripotency genes was determined at the end of reprogramming. The protein expression was determined by western blot (C). The mRNA expression was determined by RT-qPCRs (D). Values are plotted as mean ± SEM from three independent experiments. (E) Thoc2 and Thoc5 expression during early embryonic development in vivo. mRNA expression was determined by RT-qPCRs and normalized to the 1-cell stage. Values are plotted as mean ± SEM. (F) Immunofluorescence staining of Thoc2 (green) and Thoc5 (red) in E3.5 blastocysts. DAPI (Blue) was used to stain the cell nuclei. (G–H) Effect of Thoc2 or Thoc5 KD on blastocyst development. (G) 1-cell embryos were injected with NT, Thoc2, or Thoc5 siRNAs and cultured for 4 days ex vivo. Images of the embryos were taken on day-4. (H) The number of normal blastocyst formed on day-4 was counted and normalized to the number of normal 2-cell embryos formed on day-2, and plotted as mean ± SEM from three independent experiments. See also Figure S7.

