Figure 2.
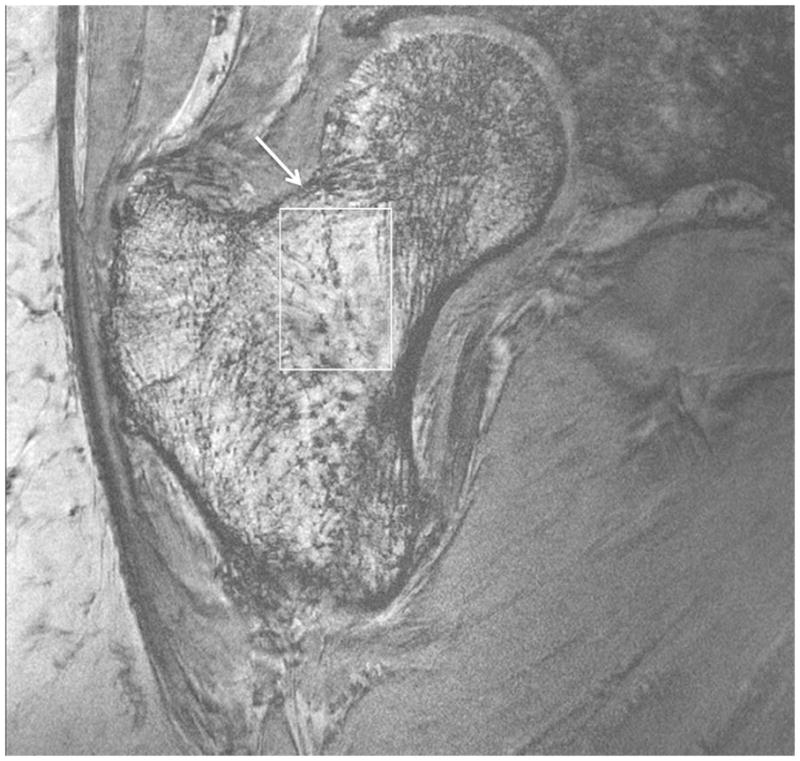
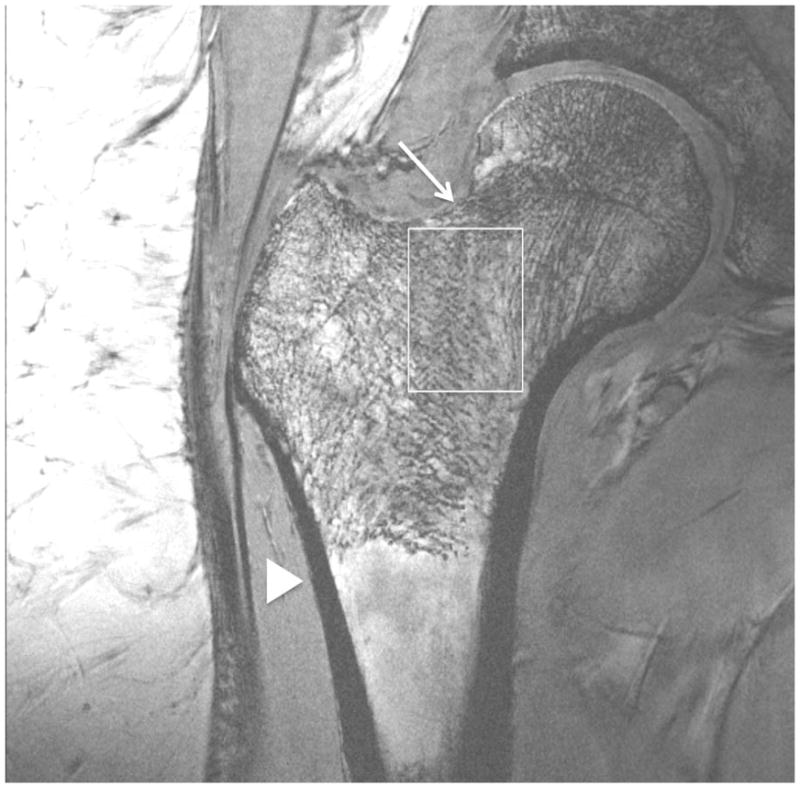
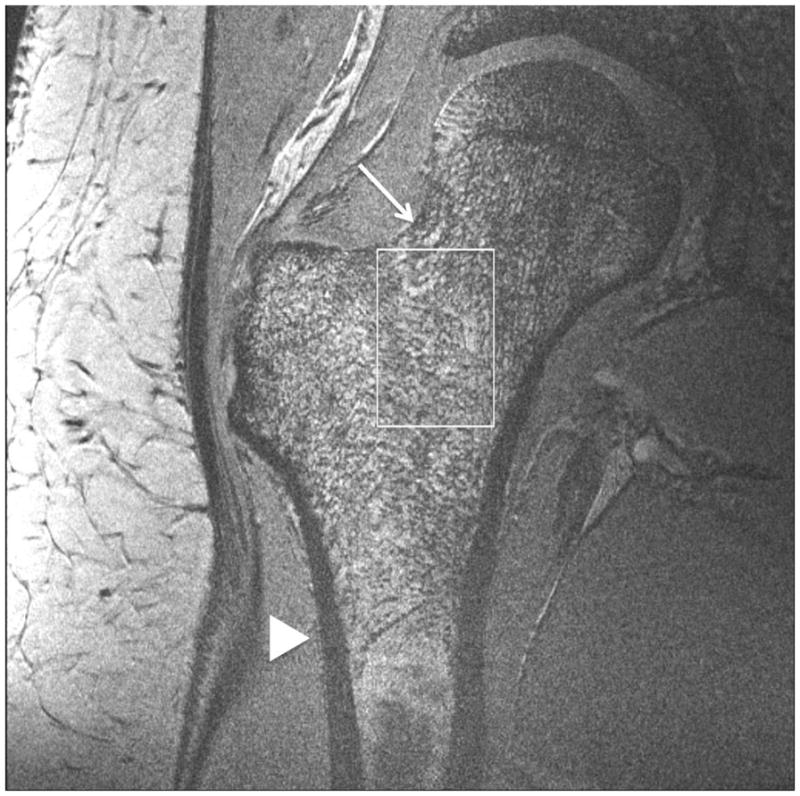
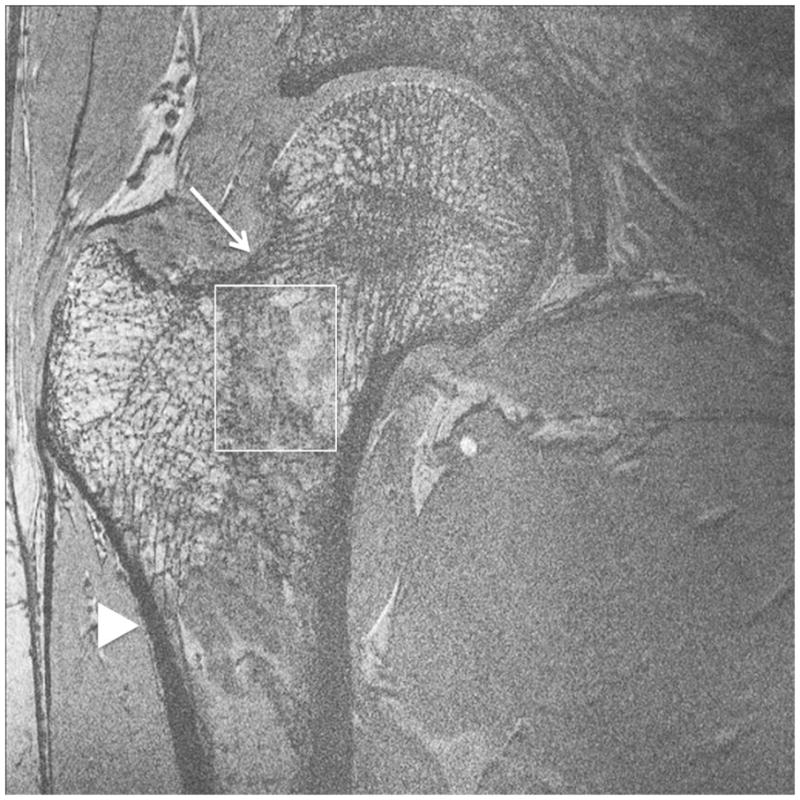
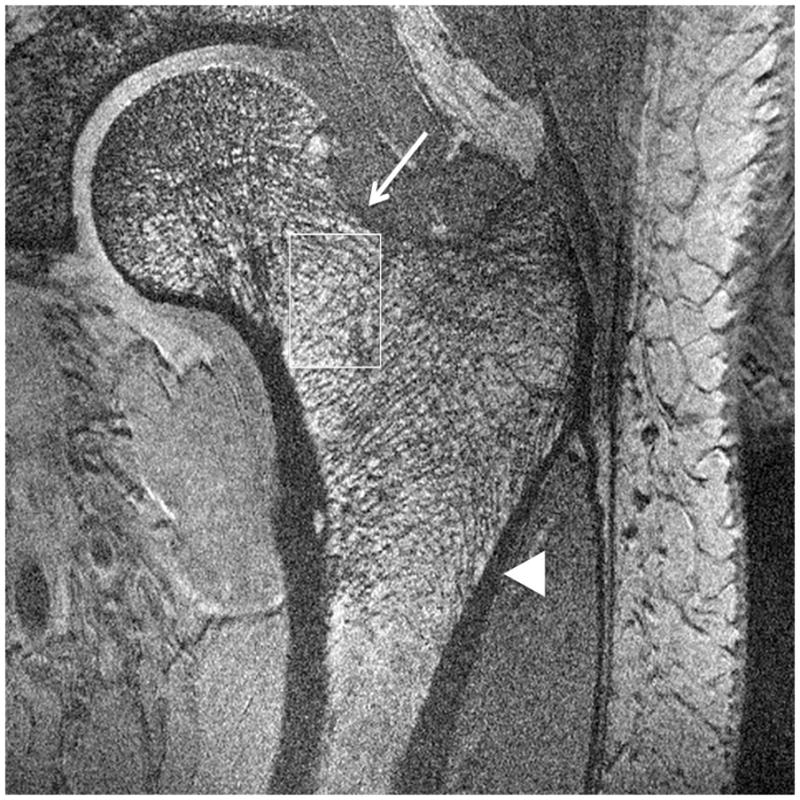
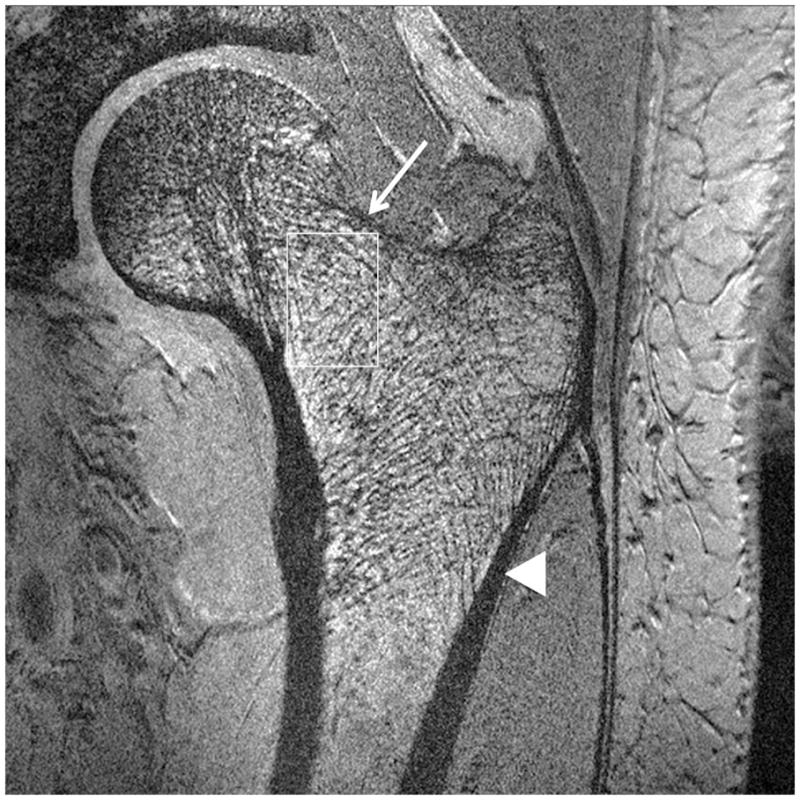
Imaging of bone microarchitecture of the proximal femur. Images in (a) and (b) were obtained at 7 T with a longer protocol (3-D FLASH, TR/TE = 31 ms/5.1 ms, 0.234 × 0.234 × 1.5 mm3, acquisition time = 21 minutes). The images in (c) and (d) were obtained at 7 T with a shorter protocol and smaller voxel size (TR/TE = 9 ms/4.1 ms, 0.234 × 0.234 × 1 mm3, 6 minutes 56 seconds). The images in (e) and (f) were obtained at 7 T in the same subject with two different shorter protocols. In (e), we used TR/TE = 9 ms/4.1 ms, 0.234 × 0.234 × 1 mm3, 6 minutes 56 seconds without parallel imaging. In (f), we used TR/TE = 18 ms/4.1 ms, 0.234 × 0.234 × 1 mm3, 7 minutes 6 seconds, parallel imaging acceleration factor of 2. Regardless of the protocol used at 7 T, individual trabeculae are visualized in the proximal femur in all images. The patients with a diagnosis of osteoporosis (bone mineral density T-scores less than −2.5) in (a) and (d) have fewer trabeculae (boxes) in the femoral neck compared to patients with osteopenia (bone mineral density T-scores between −2.5 and −1.0) in (b), (c), (e). There is thinning of the superolateral cortex of the femoral neck (arrows). Within the proximal femoral diaphysis, there are few trabeculae, but cortex is thicker (arrowheads). In the subject in (d), intermediate signal within the intertrochanteric region of the femur represents red marrow. Finally, for comparison, the image in (g) was obtained in one osteoporotic subject at 3 T using the longer protocol (TR/TE = 31 ms/5.1 ms, 0.234 × 0.234 × 1.5 mm3, acquisition time = 21 minutes). In (g), trabeculae are difficult to visualize.
