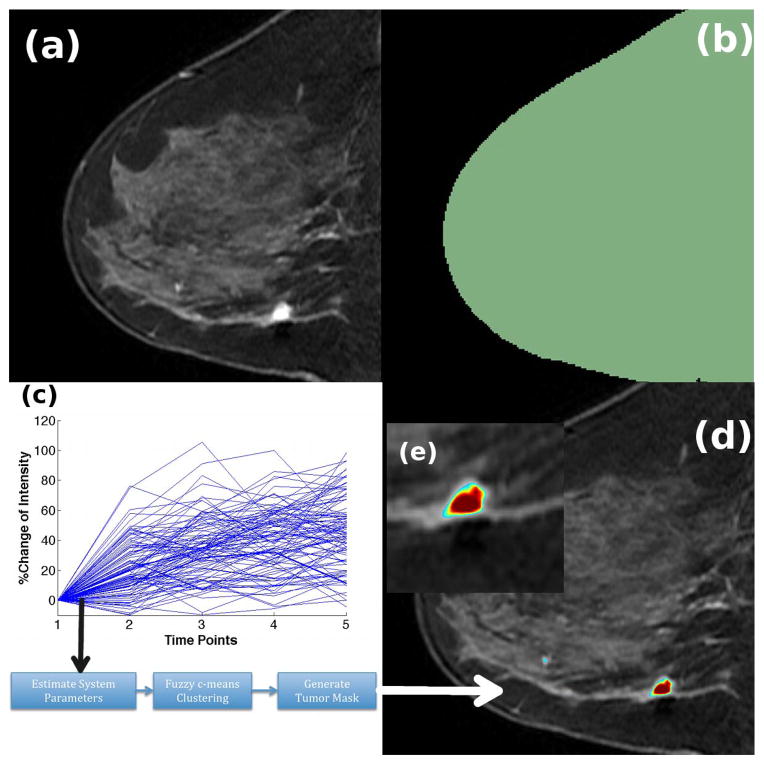
Figure 1.
Workflow of the LDS segmentation algorithm. (a) First post-contrast image of the DCE-MRI series (b) ROI delineated on the DCE-MRI using the Editor module in 3D Slicer (c) Time-intensity curves from all voxels under the ROI are logged and provided to the algorithm, which computes the LDS system parameters, clusters the voxels and generates the tumor mask (d) Tumor mask overlaid on the DCE-MRI. Red represents high tumor activity and blue represents low tumor activity

